Auto Fit
Fit a Variogram with a Mathematical Model
The Auto Fit option assists you in finding the best fit mathematical model (variogram function) for the generated experimental variograms.
Running variography produces a series of curves that represent the variance between sample pairs in various directions and at various distances. To use this variance information in kriging, it is necessary to produce a variogram function that fits the variography.
Although this option helps you in finding a good variogram function, it is not intended to be a final answer in fitting variograms. The auto fit procedure has no understanding of geology or of your particular deposit. It is only a tool to get you started in analysing your variography data. A geologist should always examine the results to see if the answers are good and applicable in your particular situation.
This option uses a Monte-Carlo random selection of variogram functions. Each function is measured against the variography data to assess its closeness of fit in a least squares sense. The function that has the best fit is reported as the automatically fit variogram function.
The Monte-Carlo process randomly varies the parameters of the variogram function. It varies the nugget, the sills, the orientation angles and the ranges all simultaneously. This means that not all combinations of parameters are tried. However, with 100 000 Monte-Carlo trials the automatic fit procedure usually finds a reasonable combination of parameters that gives a good fit to the variography data. It is not the best possible fit, because only a finite number of random coefficients are tested.
This option finds a close fit to the variography data in a least squares sense. The variogram function is evaluated at each lag location and compared with the computed variography data. The differences are weighted by the number of sample pairs in each lag.
The result of the auto fit process is stored in the file <proj><name>.vrg. This file is used by the Edit, Display and Multi Display options. It is also used by the kriging estimation options. An example is given in Appendix A.
Instructions
On the Block menu, point to Variography, and then click Auto Fit to display the Variography Parameter Identifier panel.
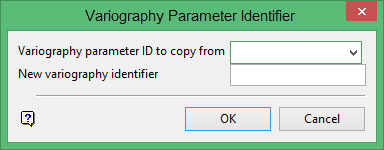
Variography parameter ID to copy from
This is an optional field for the name of an existing variography parameter file. It to copy an existing file and modify the copy to reflect specific requirements for the new parameters.
New variography identifier
Enter the name of the new parameter file. The maximum size is 10 alphanumeric characters.
Click OK.
The following panel is then displayed.
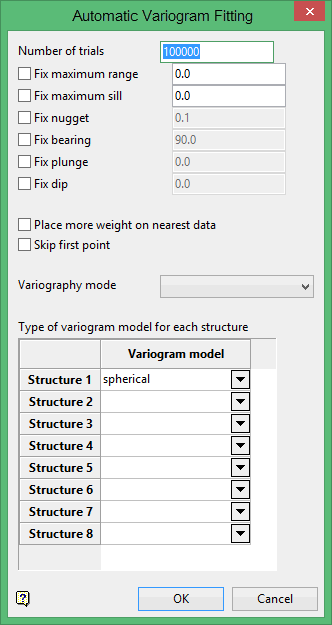
Number of trials
Enter the number of trials. This controls the number of random sample variogram functions tested by the Monte-Carlo method. If this number is small, only a few functions are tested, and it is unlikely that a good fit will be found. If the number of trials is large, it takes longer to run, but it is more likely that a good fit is found. A reasonable range of values to use is from 1000 to 100000.
Maximum range
Enter the maximum range. When the range is zero (0), all variography data, at any range, is used. If a positive number is entered, only variography lags at less than this range are used. You might use this limit to ignore variography data at larger lags if you initially computed variography at distances well beyond the range of the sill.
Maximum sill
Enter the maximum sill. When this number is zero (0), the auto fit procedure examines the variography data to find the largest variance. It then examines functions with total sill in the range of zero (0) to the maximum variance. If a positive number is entered here, variogram functions with total sill from zero (0) up to this maximum are tested. You might use this limit if you know the total sill of your variogram function is less than one (1), but your variography data contains some lags with larger variances.
Fix nugget
Select this check box to correct the current nugget value. The nugget value represents the variability of sample data at short distances.
The following values define the orientation of the variogram structure:
Fix bearing
Select this check box to correct the current bearing value.
Fix plunge
Select this check box to correct the current plunge value.
Fix dip
Select this check box to correct the current dip value.
Place more weight on nearest data
Select this check box to weigh the variogram points using the distance to the point. Hence smaller range samples have more weight. The system matches the smaller range lags at the expense of the more distant lags.
Variography mode
Select the variography mode. If you created more than one type of experimental variogram (through the Create option), then you can choose which type to use for the fitting.
Type of variogram model for each structure
Select the mathematical model to use for each structure. If you choose two structures, then you may want to increase the number of trials to get a better fit.
Valid models are:
- Spherical (the most common for metal deposits)
- Exponential3
- Gaussian3
- Linear
- DeWijsian
- Power
- Periodic
- Exponential
- Gaussian
- Dampened Hole Effect
Refer to the Variogram Model Types section for a description of each available model type.
Click OK.
The auto fitting process is run in a shell window. As the fitting progresses, the variance value becomes smaller.

