Cube
Use the Cube option for different way of computing and displaying variography data. Instead of computing variography in radially defined cones, the variography is computed in cubes. For each sample data pair, the difference vector is taken and the variography information for the cube in which the head of the vector lies is updated. The variography is written into a block model.
The block model is located around the origin in variography coordinates. You can display a block model of variography data using the usual block model display tools. For example, you can slice the block model, contour the block model, or load individual blocks with various colour schemes. The only requirement is that you create a Vulcan view of the space around the origin. The display of the variography block model gives a true three dimensional view of the variance of your data. You can also display the sill ellipsoid over the block model to see how well the ellipsoid matches the continuity in the variography data. The format of the block model file name is:
<proj><bfi>_vrs.bmf
Also generated is an associated _vrs.bdf file (block definition file). See Appendix A for an example of the _vrs.bdf file.
Requirements
-
Create a Vulcan view of the space around the origin.
Results
-
The cube variogram is created in a shell window. The process creates a block model file that can be displayed with the usual block display options, such as slicing or display blocks (refer to Block > Viewing ).
-
A display of the variography block model that provides a true three dimensional view of the variance of your date.
-
You can also display the sill ellipsoid over the block model to see how well the ellipsoid matches the continuity in the variography data.
-
A block model file with the format: <proj><bfi>_vrs.bmf.
-
An associated file _vrs.bdf file (block definition file). See Appendix A for an example of the _vrs.bdf file.
Instructions
On the Block menu, point to Variography, and then click to display the Variography Parameter Identifier panel.
Select the Variography parameter ID to copy from, or enter a new variography identifier.
Variography parameter ID to copy from
This is an optional field for the name of an existing variography parameter file. It allows you to copy an existing file and modify the copy to reflect specific requirements for the new parameters.
New variography identifier
Enter the name of the new parameter file. The maximum size is 10 alphanumeric characters.
Click OK to display the Variogram data selection panel
Use samples database
Select this option to use a samples database
Isis File
Select this option to nominate an Isis database. The drop-down list displays all Isis database filed found in your current working directory. Click Browse to select a file from another location.
ODBC Link
Select this option to nominate an ODBC link database. Select the design name from the drop-down list.
Use map file
Select this option in you want to use an ASCII mapfile (.map ).
Group
Enter the name of the group(s) (or database keys) to be loaded. Wildcards (* multi character wildcard and % single character wildcard) may be used to select multiple groups.
Multiple groups only apply to Isis databases. ASCII mapfiles consist of one group. If you plan to use a triangulation to limit the sample values (next panel), then you must select values for the X, Y, and Z coordinate fields for the samples.
X/Y/Z fields
If down hole variography is not selected, then standard variography in three dimensions is performed. Enter the X, Y, and Z coordinate fields for the samples.
W field
Enter the name of the grade variable.
Second W field
Enter the name of the second grade variable. This should only be entered for cross-variography.
Click Next and enter Variogram sample limits.
This panel allows you to limit the sample values.
Select using a Numeric tag
This method allows you to limit the samples to a numeric field and then only to those entries in this field that have specific numeric values or to ignore those entries. A range of values can also be specified.
Example: You may have a database field named BOUND and the entries in this field are 1, 2 and 3, representing, respectively, ore, waste and internal waste. To use only value 1 (ore) you would check the Use specific Numeric values box and specify 1 as the specific value. The specification of the value(s) is done through the Specific W Values panel, which displays once this panel has been completed.
Ignoring specific values is useful for eliminating certain negative values to be included in your grade estimation. The specification of the value(s) to be ignored is done through the Ignore W Values panel also accessed upon completion of the panel.
Up to 10 values can be specified both for inclusion or exclusion in the grade estimation.
A range instead of specific values is useful to ignore a whole range of values, for example, 0 to 9999 to ignore all negative values. It can also be used to ensure any rounding errors are caught, for example, -99 may actually be -99.00001 due to computer storage. The panel for specifying a range is named the Range of Numeric Values panel.
Select using a Character tag
This method allows you to limit the samples to a character field and then only to those entries in this field that have specific character strings or to ignore those entries.
Ignoring specific character strings may be useful to eliminate certain strings, for example, waste, from being included in the grade estimation. The specification of the string(s) to be ignored is done through the Ignore Character Strings panel.
As with numeric values, up to 10 character strings can be specified.
Select using solid triangulations
This method allows you to limit the samples by triangulation and then only those samples that lie in the triangulation. You will be prompted for the triangulation upon completion of the current panel.
Use Field restrictions
This method allows you to limit the samples to 15 numeric fields and then only samples that match certain selection criteria. Do not use spaces in the condition.
The range entered must always have the smallest number specified before the largest number, for example, '-792&-720', since -792 is smaller than -720.
Each option in the above-described methods is accumulated, that is, if more than one option is chosen the samples must satisfy each selected option before being included. Within an option however, selection is based on the OR selection criterion except for field restrictions that allow AND/OR selection criteria.
Click Finish and enter Variogram selection information.
The Create Variogram option to define the parameters from which experimental variograms are generated.
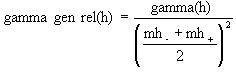
General relative semivariogram
This is the similar to the standard semivariogram divided by the mean of the data values.
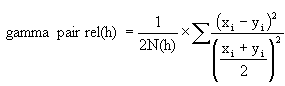
Pairwise relative semivariogram
This is similar to the standard semivariogram with each difference divided by the mean of the sample values.
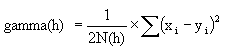
Semivariogram
This is the standard semivariogram.
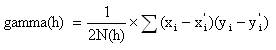
Cross semivariogram
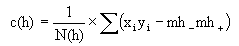
Covariance
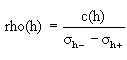
Correlogram
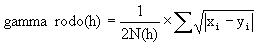
Rodogram
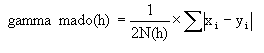
Madogram
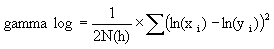
Semivariogram of logarithms
Indicator semivariogram
Transform data is: 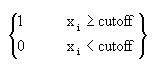 and compute the semivariogram.
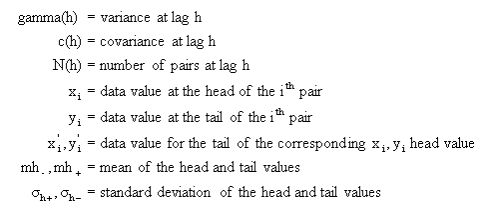
where:
Click Next and enter Cube setup information.
X/Y/Z cube range
For each dimension, enter the range of the variogram model. A range of 105 means that the block model extends from 105 to 105.
X/Y/Z lag size
For each dimension, enter the size of the cube. The size is usually in the order of the distance between samples. Making the size large puts more sample pairs into each block, but reduces the resolution.
Click Next.
The cube variogram is created in a shell window. The process created a block model file that can be displayed with the usual block display options, such as slicing or display blocks.

