Contour
Use this option to contour (in any plane) variables in a block model. Contours can be saved as a layer for plotting or for use as design strings.
Instructions
On the Block menu, point to Viewing, then click Contour.
Note: If a block model is not currently open, you will be prompted to open one first. The directory path and filename of the currently open block model will be displayed at the top of the panel.
Follow these steps:
-
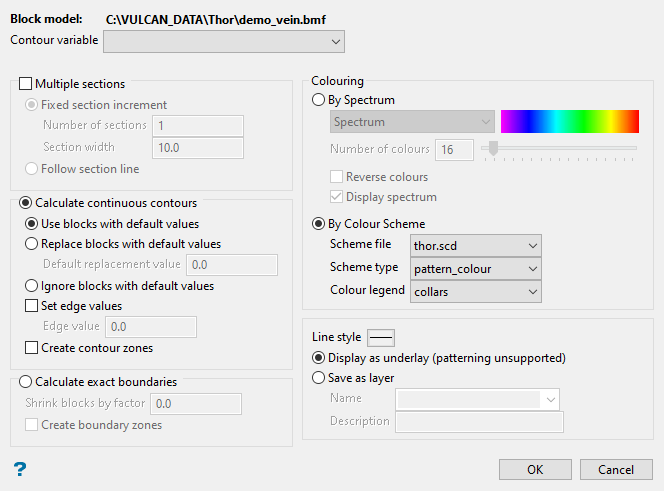
Select the Contour variable to be contoured from the drop-down list. The variable does not need to be a numeric variable. It can be an alpha variable as well, such as a variable describing geology or rock type.
-
Select the Multiple sections option to create more than one slice.
-
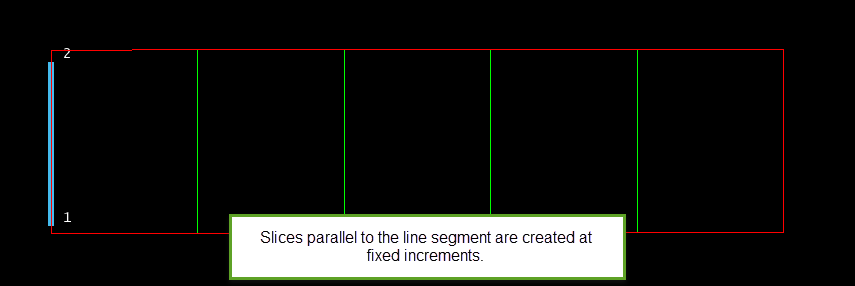
Fixed section increment - Select this option to create the sections at a fixed increment. You will need to specify the number of sections to create, as well as the distance between each one.
-
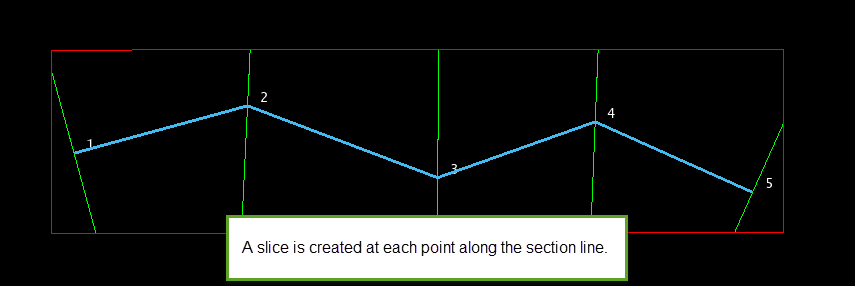
Follow section line - Select this option to create the sections using an existing section line. Once the panel is complete, you will be required to select the section line from the screen. A section will be generated along the chosen line.
-
Select between Calculate continuous contours or Calculate exact boundaries.
-
Use Calculate continuous contours to generate regular contours in the same style as surface contours.
Note: This option will not work with alpha contours.
If a block contains a default value instead of an assigned value, then the default value can be treated in three ways:
-
Use blocks with default values - Select this option to use default numbers in blocks.
-
Replace blocks with default values - Select this option to replace defaults with another value. Enter the value.
-
Ignore blocks with default values - Select this option to imply the use of edge values.
Set edge values - Select this to display a nominated edge value at the edge of blocks without adjacent blocks.
Create contour zones - Select this to post-process generated continuous contours into zones, group areas of the same code, for example, geological zones/weathering, etc. This can also be applied to grade values where the supplied range is used to define the contours, permitting high grade/low grade definition.
Note: For Create contour zones to be enabled, you must be using a Pattern scheme for the colour legend.
-
-
Use Calculate exact boundaries to group areas of the same code together, for example, geological zones. This can also be applied to grade values where the supplied range is used to define the contours, permitting high grade/low grade definition.
Note: If you choose to calculate zonal contours, then you will be required to enter a Shrink factor. Specifying a shrink factor will allow you to shrink the block markers to ensure that the edges do not overlap. The factor (or gap), which must be between '0' and '1', is entered in plotter units.
Create boundary zones - Select this to post-process generated boundaries into zones. This can also be applied to grade values where the supplied range is used to define the boundaries, permitting high grade/low grade definition.
Note: For Create boundary zones to be enabled, you must be using a Pattern scheme for the colour legend.
-
Set how the block model slice will be coloured using the options in the Colouring section.
-
Select the By Spectrum option to colour the slice by spectrum. This means that the selected colour spectrum is stretched over the variable values. If you select the Between two RGB values option from the drop-down list, you will need to nominate two colours to stretch over the variable values. For example, if you select red and blue, then the small values would be red, the middle values purple, and the large values blue. The colour of the middle values is an average of the two chosen colours.
-
Select the By Colour Scheme option to colour the slice by using a Vulcan colour scheme. A default scheme file and type is entered automatically, these can be altered. Select the file, type, and colour legend from the drop-down lists.
Note: If you choose a block alpha scheme when using a numeric variable or numeric with alpha, an error message will appear and you will be returned to the panel to correct the problem.
-
-
Select whether you want the contours displayed as an underlay or displayed and saved as a layer. Layers are useful if you want to snap lines to them or do any further design work, for example, pit design or plotting.
Important: Underlays do not support patterns.
If you have choose to save the contours in a layer, then you will be required to specify a layer name.
The drop-down list contains the names of all currently loaded layers. If you select an existing layer, then the resulting data will be appended to the nominated layer. If you enter the name of an existing layer that is not currently loaded, then you will need to confirm whether you want to load the layer or replace it, i.e. overwrite its contents.
To create a new layer, enter the layer name. The layer name:
-
may contain up to 40 characters.
-
must begin with an alphanumeric character [0-9] or [a-z].
-
cannot include spaces.
-
can include hyphens [ - ], plus signs [ + ], underscores [ _ ], periods/dots [. ].
-
can include the special characters that are used in the Spanish and Portuguese languages.
-
-
Click OK to display the Contour Plane panel.
 Dip
Dip
The dip is the angle of the section from horizontal. Valid dip angles are between -90° and 90°.
Select section by line
Select this option to define the plane by selecting an existing line and specifying the dip.
Only design strings may be picked and it is not possible to pick a line in an underlay. The direction of the view, and therefore the direction of the stepping, depends on the digitised sequence of the line. The digitised sequence of the line can be reversed using the Reverse option (under the Design > Object Edit submenu).
Select by points
Select this option to define the plane by digitising two points and specifying the dip.
To locate a point precisely, use the
 Snap to Objects or
  Snap to Points modes (on the Digitise toolbar ). Points may be snapped onto underlays, such as block model slices or triangulations. If you use Indicate
  mode to select the points, then the points have the current default Z value.Select by grid coordinate
Select this option to define the plane by using a specific grid coordinate. The grid coordinates can contain up to three decimal places. To achieve the best results for the following three methods, we recommend using the Zoom Data Extents button
 (on the Graphics toolbar ) in order to view all of the graphics.
-
By Easting - Select this option to enter a specific Easting value (X value).
-
By Northing - Select this option to enter a specific Northing value (Y value).
-
By RL - Select this option to enter a specific RL value (Z value).
Select by 3 points
Select this option to define the plane by digitising 3 points. To locate a point precisely, use the Snap to Objects
or Snap to Points modes (on the Digitise toolbar ). Points may be snapped onto underlays, such as block model slices or triangulations.Using this option will allow you to explicitly define the location and orientation of a plane by indicating 3 points. The first two points define the bearing of the plane, and the third point defines the dip of the plane.
-
-
Click OK.
The sections are then contoured.

