Data Posting
Use this option to create plots of points from sources such as databases, mapfiles, design and CSV files. You can view multiple data values plotted at one location, with multiple outputs such as underlays, layers, text and spreadsheet files. Data points can be sized or colour-coded based on database values. Values such as horizon thickness, interburdens and partings can be automatically calculated directly from lithological logging.
Instructions
On the Design menu, point to Data Posting.
Open Specification
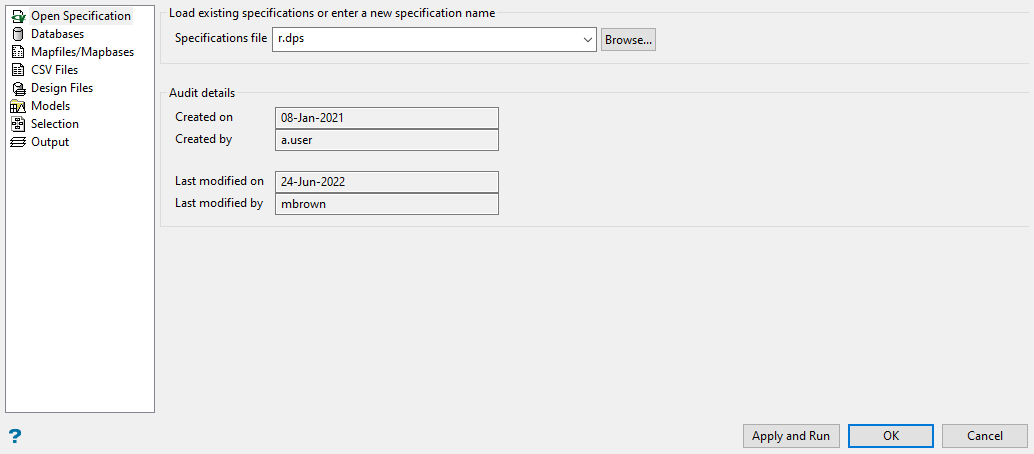
Specifications file
Select the Data Posting specification file ( .dps ) that you want to open. The drop-down list contains all of the .dps files found in the current working directory. Click Browse to select a file from another location. Once a specification file has been chosen, the parameters contained in the nominated file will be used to populate the Data Posting interface.
To create a new file, enter the file name and file extension. By default, the resulting file will be stored in the current working directory. Use the Browse button to select a different file location.
Audit details
These fields will be automatically populated if the nominated specification file has any modification history. The Created on/by and Last modified on/by fields are 'read-only', i.e. the entries cannot be manually altered by a user.
Databases
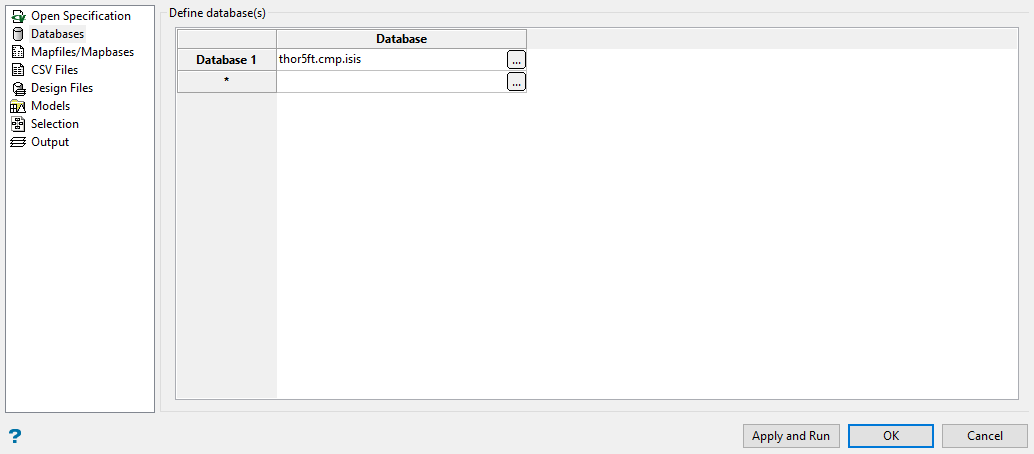
Click  to define a database. Once selected, the Database source details panel displays.
Database tab
Isis File
Select this option to nominate an Isis database. The available drop-down list displays all Isis database files found within your current working directory. Click Browse to select a file from another location.
ODBC Link
Select this option to nominate an ODBC link database. Select the design name from the drop-down list.
Scheme tab
The Scheme tab allows you to nominate the header and interval schemes. The values in the Scheme tab will be populated with the synonyms from the design of the selected database.
Header schema
Select the tables and fields that define the holes to be used. By default, the synonyms from the selected structural database will be used. These values can be changed if desired, i.e. you can use different tables or fields.
Interval schema
Select the tables and fields that define the interval schema that will be used to identify the structure. By default, the synonyms from the selected structural database will be used. These values can be changed if desired, i.e. you can use different tables or fields.
Drillhole Selection tab
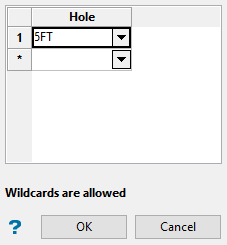
Drillholes can either be limited by name or by position. If none of the options within this section are selected, then all available drillholes will be used. Entries within the nominated Drillhole Selection files (.sel), as well as the drop-down lists, may contain wildcards (both * multiple and ? single character).
You can create a drillhole selection file by selecting drillholes of interest, then right-click and select Drillhole > Selection File from the context menu to enter a file name and save the .sel file for future use. This essentially creates a text file that contains a list of hole identifiers with the format shown below. You can also create a selection file manually using a text editor and saving the file with the .sel extension. Note that drillhole names in the selection file are case sensitive.
Drillhole selection file format:
DD00026
DD00035
DD00044
DD00053
DD00116
DD00143
Selection Files
Inclusion File
Select this box if you want to limit the drillhole selection to only those holes that are contained within the nominated Drillhole Selection file (.sel). The drop-down list contains all.sel files found within your current working directory. Click Browse to select a file from another location.
Exclusion file
Select this box if you want to limit the drillhole selection to only those holes that are not contained within the nominated Drillhole Selection file (.sel). The available drop-down list contains all.sel files found within your current working directory. Click Browse to select a file from another location.
Selection Names
Inclusions/Exclusions
Select this box if you want to include a specific list of drill holes chosen according to their name. Select the Select button to specify what drill holes will be included. The Include Names panel will be displayed.
Select the drill holes that you want to include.
Select the drill holes that you want to exclude.
Selection Polygons
Select by polygon
Select this box if you want to limit the drillhole selection to only those holes that fall within a nominated polygon.
Design database
Specify the design database that contains the layer and polygon object. The drop-down list contains all design database files found within your current working directory. Click Browse to select a file from another location.
Layer name
Specify the name of the layer that contains the polygon object. The drop-down list contains all layers found within the chosen design database.
Object name
Enter the name of the polygon object that will be used to limit the drillholes. Wildcards (both * multiple and ? single character) can be used.
Horizon List tab
The Horizon List tab allows you to define a horizon list, which can then be used through the Horizon selection tab when selecting horizons for plotting.
Define horizon list file
Select this check box to define a horizon list file to be composited.
GDCALC global file
Select this option to use the horizon information contained in an existing GDCALC global file ( .gdc_glob ). The available drop-down list displays all .gdc_global files found in the current working directory. Click Browse to select a file from another location.
Horizon list file
Select this option to use the horizon information contained in an existing Horizon list file( .hzn ). The drop-down list contains all .hzn files found in the current working directory. Click Browse to select a file from another location.
Note: Values in horizon list files must be separated by a commas, spaces or tabs.
Horizon Selection tab
Select horizon(s)
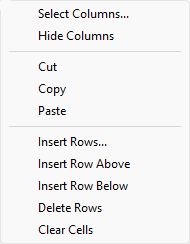
The panel utilises grid controls to manage the grid information, i.e. right-click context menus, that allow you to perform options such as hiding columns, cutting, copying, and pasting cells, and inserting and deleting rows. Right-click in the grid area to display the context menu. Descriptions of the available options are listed below.
-
Use the Select Columns option to choose which grid columns to display in the panel, and optionally save the selection to a template for future use. Alternatively, select cells and click Hide Columns to hide the respective columns directly.
-
Select cells and use the Cut, Copy, and Paste options to duplicate or move cell entries.
-
Select a cell in a row of interest and use the various insert and delete row options to manage the records in the grid.
-
Click Clear Cells to clear the contents of a selection.
Select horizons and/or a horizon group
Select this check box to use the information contained in the file that was nominated through the Horizon list tab. Select the Load button to load the horizon information.
Select horizon range
Select this check box to specify a horizon range. Select the top and bottom horizons from the drop-down lists.
Mapfiles/Mapbases
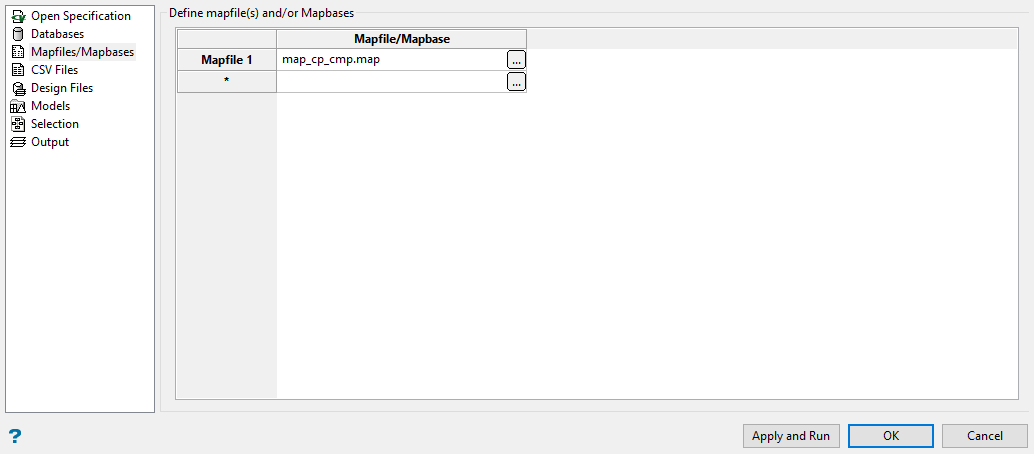
Click ![]() to define the mapfiles. Once selected, the Setup mapfile details panel displays.
to define the mapfiles. Once selected, the Setup mapfile details panel displays.
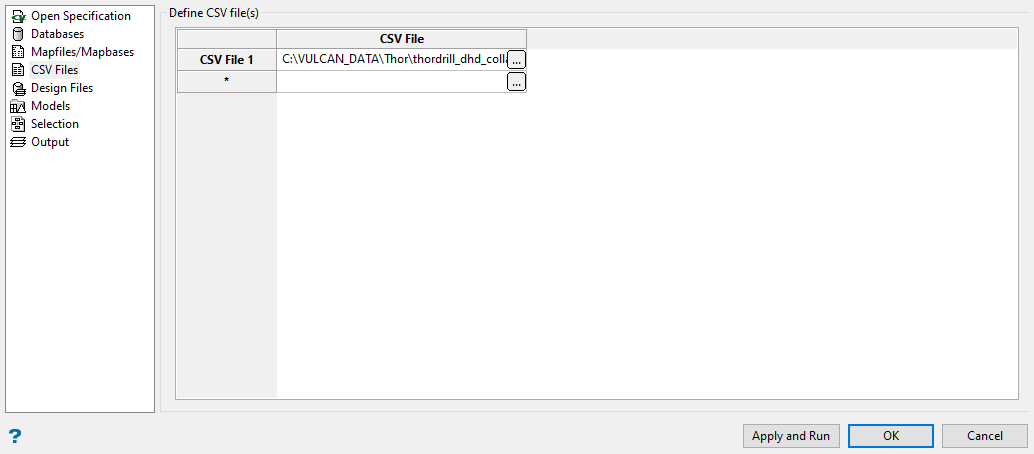
CSV Files
 /
/
Click ![]() to define the CSV files. Once selected, the Setup CSV details panel displays.
to define the CSV files. Once selected, the Setup CSV details panel displays.
Design Files
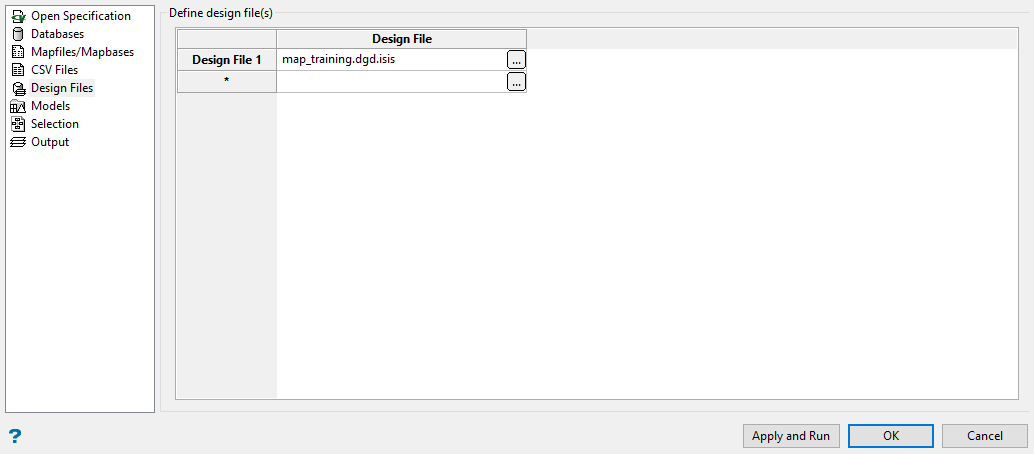
Click ![]() to define the design files. Once selected, the Setup design file details panel displays.
to define the design files. Once selected, the Setup design file details panel displays.
Models
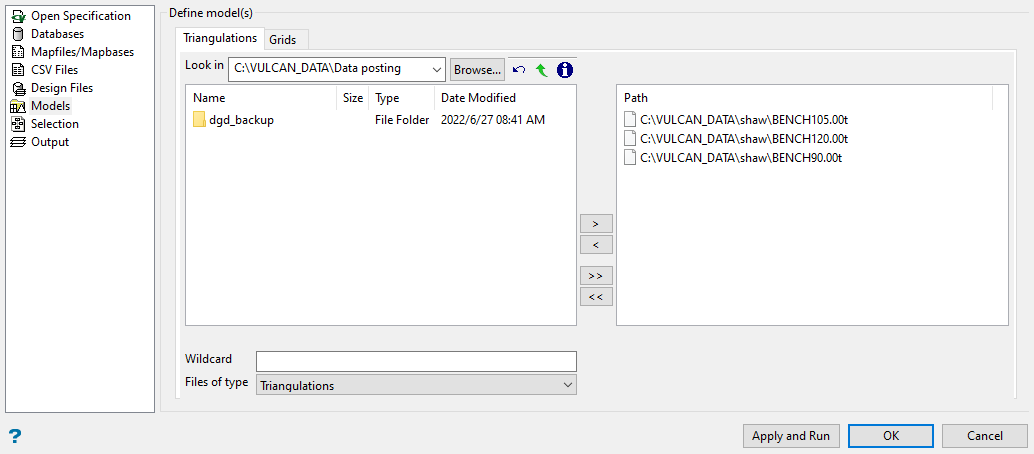
File Selection
Browse for files using the Browse button, or use the interface showing the available grid files in the current working directory.
Click on the name of the file(s) you want to select. Use the  icons to go to the last folder visited, go up one level, or change the way details are viewed in the window.
To highlight multiple files that are adjacent to each other in the list, hold down the Shift key and click the first and last file names in that section of the list.
To highlight multiple non-adjacent files, hold down the Ctrl key while you click the file names.
Move the items to the selection list on the right side of the panel.
- Click the
 button to move the highlighted items to the selection list on the right.
 - Click the
 button to remove the highlighted items from the selection list on the right.
 - Click the
 button to move all items to the selection list on the right.
 - Click the
 button to remove all items from the selection list on the right.
Wildcard
Enter any characters used as wildcards. Wildcard characters can be an * as well as regular characters.
Example: If the topo_* were used as a wildcard, the result might be topo_area2_aerial, topo_min, or topo_with_pit.
Files of type
Use this to filter the file types that display in the search list.
Selection
Select layout tab
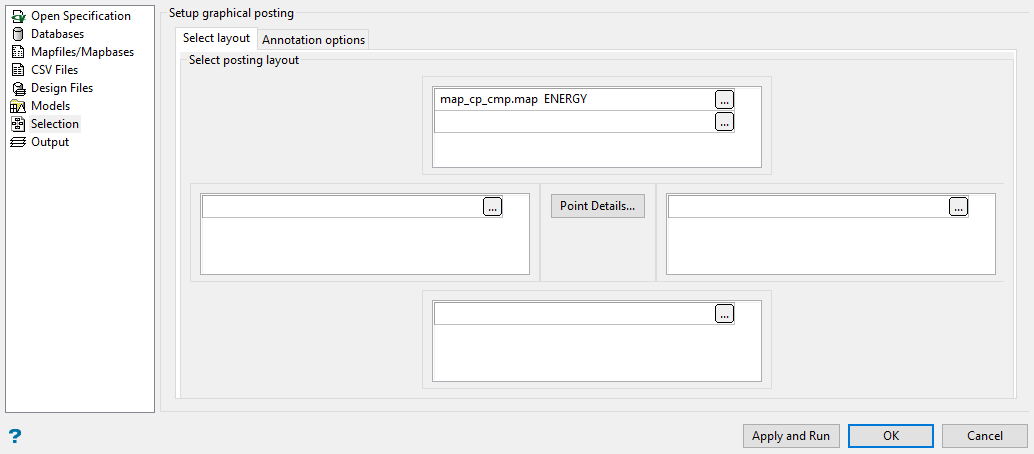
Note: The resulting text annotations will be assigned group codes of TOP , LEFT , RIGHT and/or BOTTOM. The assigned group code refers to the annotation's position in relation to the data point, for example labels displayed above the point will be assigned a group code of TOP.
Annotation options tab
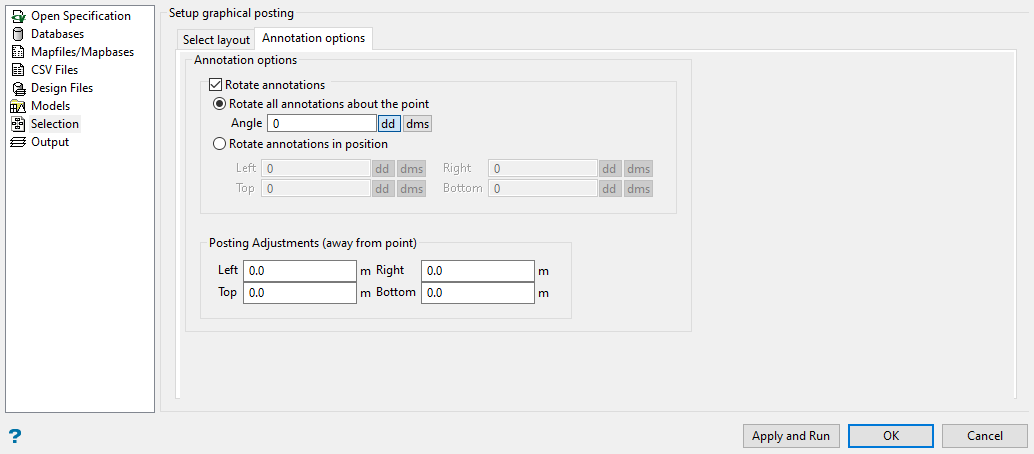
Annotation options
Check the Rotate annotations check box to rotate the annotations by a given angle. You can either rotate all available annotations or only those annotations that are displayed at a certain position, for example rotate all annotations that are displayed to the left of a point by 10°.
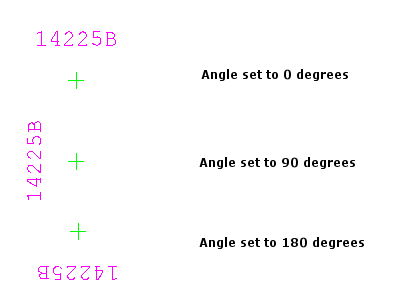
Figure 1 : Rotation Examples
The rotation angles can be entered in decimal degrees or degrees minutes seconds ( ddd.mm.ss ). To do so, select the appropriate angle format button and enter the drafting angle.
For example, to enter a drafting angle of 50°, select the ![]() button and enter
button and enter 50 as the drafting angle. Select a different angle format button to convert a value, for example 50° will become 55.555556 if the ![]() button is selected.
button is selected.
Posting Adjustments
This section allows you to adjust the label positions. The labels will be moved away from the posting point, for example to the left or right, by a given distance. You have the ability to enter up to 4 adjustment values.
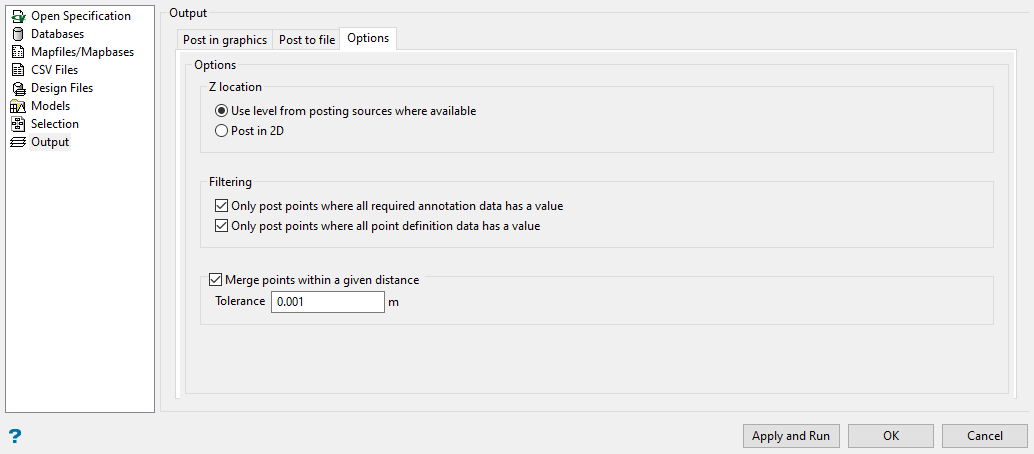
Output
Post in graphics tab
Underlay
Select this check box to store the posting data in a single underlay. Underlays cannot be saved, i.e. your posting data will be lost once you close the current Vulcan session. Datatip information is available for each of the posted underlay points. To display datatip information, position the mouse cursor over a posted point.
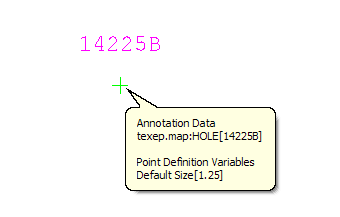
Figure 2 : Datatip Information
Note: The Display Datatips check box (under the Graphics section of the Tools > Preferences option) needs to be checked in order to display datatips.
To remove the underlay from the screen, select the File > Underlays >Remove Underlay option.
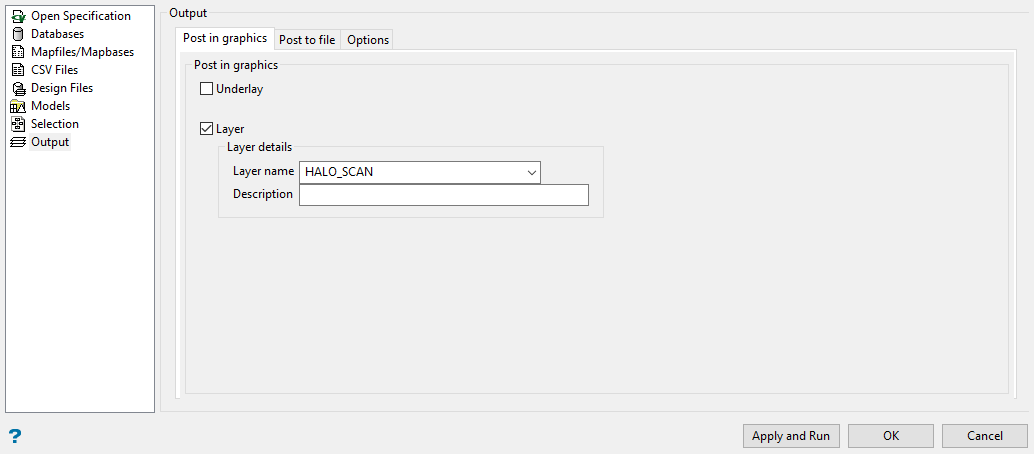
Layer
Select this check box to store the posting data in a nominated layer.
The drop-down list contains the names of all currently loaded layers. If you select an existing layer, then the resulting data will be appended to the nominated layer. If you enter the name of an existing layer that is not currently loaded, then you will need to confirm whether you want to load the layer or replace it, i.e. overwrite its contents.
To create a new layer, enter the layer name. The layer name:
-
may contain up to 40 characters.
-
must begin with an alphanumeric character [0-9] or [a-z].
-
cannot include spaces.
-
can include hyphens [ - ], plus signs [ + ], underscores [ _ ], periods/dots [. ].
-
can include the special characters of ÁÂÃÀÇÉÊÍÓÔÕÚÜÑ that are used in the Spanish and Portuguese languages.
A layer description can be used to further describe the contents of the layer. A layer description can contain up to 80 alphanumeric characters (spaces are allowed). If a description is not entered, then a default description will be used instead. If the chosen layer already has an assigned description, then this displays when the layer is selected. Existing layer descriptions can be overwritten.
Note: The resulting text annotations will be assigned group codes of 'TOP , 'LEFT , 'RIGHT and/or 'BOTTOM. The assigned group code refers to the annotation's position in relation to the data point, for example labels displayed above the point will be assigned a group code of 'TOP.
Post to file tab
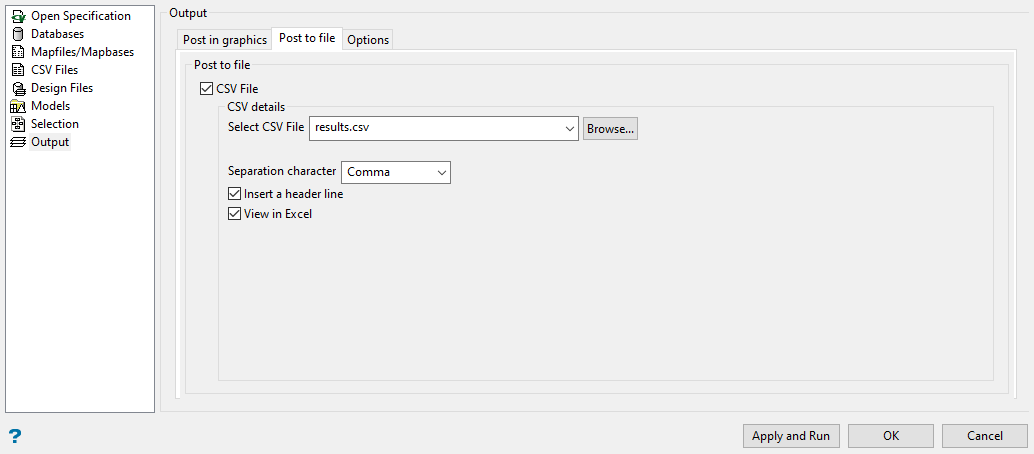
Check the CSV File check box to store the posting data in a nominated CSV file.
To create a new file, enter the file name and file extension.
Separation character
Select the character that will be used to separate the values in the resulting file. The default separator used is a single comma, but any character can be used. The [TAB] character, which is entered as \T , can also be used to separate the fields.
Insert a header line
Select this check box to place a heading above each column in the resulting file.
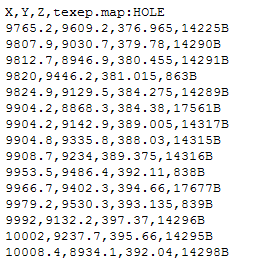
Figure 3 : Example Output (as viewed through Notepad)
View in Excel
Select this check box to view the resulting output through Microsoft Excel as soon as the CSV file as been created/updated.
Options tab