Database Drift Analyser
The Database Drift Analyser option allows you to study the how grade values change in different directions. It does this by calculating moving window averages along the main three orthogonal axes of a set of point data. The area covered by the point data is divided into slices of a given width, including some optional overlapping at both ends. After the points for given slices are selected, statistics for these points are calculated and plotted.
The following diagram demonstrates how slices are constructed.
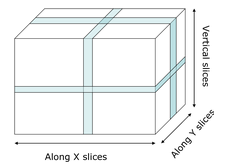
Figure 1 : Slices
Samples can be taken from the slice itself as well as from a defined neighbourhood or overlapping region. The following diagram demonstrates an overlap value.
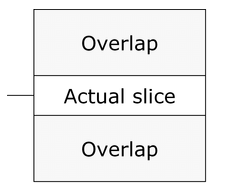
Figure 2 : Slice Overlapping
Overlapping or extended search neighbourhoods may be useful when trying to generate smooth drift outputs that can be used as models for subsequent use, for example in grade simulation.
Instructions
On the Geology menu, point to Sampling, and then click Database Drift Analyser to display the Database Drift interface.