Edit Trace Specifications
Use the Edit Trace Specifications option to define and edit specifications that control the display of geophysical traces. The information configured through this option will be saved into your Geophysics specification file ( geophysic.spec ).
The Geophysics specification file should be located in your current working directory. If the file does not exist in your current working directory, then the Edit Trace Specifications option can be used to create one.
Note: If you are using ageophysic.spec file from an earlier version of Vulcan, then the Edit Trace Specifications option can be used to convert the file to the Vulcan format.
Instructions
On the Geology menu, point to Downhole Geophysics, and then click Edit Trace Specifications to display the Edit Trace Specifications panel.
If you are using a geophysic.spec file from an earlier version of Vulcan, then you will be asked to convert the file first.
Database
Select the Choose button to nominate an Isis database or ODBC link through the Database panel. Certain fields in the available grid will be populated according to the contents of the chosen database or ODBC link.
Name
Enter the name for the trace specification.
Type
Nominate how to display the geophysical information, i.e. trace or bar graph.
Table
Select the table that contains the geophysical data.
Depth Field
Select the field that contains the downhole depth value.
Depth Type
This option is available when Type is set as Bar Graph.  It is not available if Trace has been selected as Type. Depth Type determines whether the bar of the graph will begin at the interval or if it will be offset and begin one interval before  In the diagram below, the top bars of both sides of the drillhole reflect the interval with the assay value of 1.550.
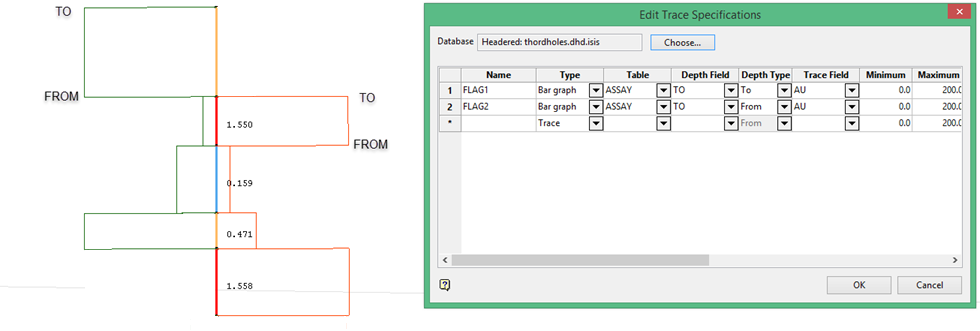
FLAG1 is coloured orange and FLAG2 is coloured green. Â Note that FLAG1 Depth Type is set as To, and FLAG2 Depth Type is set as FROM.
Trace Field
Select the field that contains the geophysical data that you want to display.
Minimum
Enter the minimum value for the trace field.
Maximum
Enter the maximum value for the trace field.
Colour
This field allows you to specify how the displayed trace will be coloured. Click the ellipse  to display the Colour Method panel.
You can either use a single colour for the trace, colour by spectrum or use an existing Pattern colour legend to colour the trace. Check the Colour by different trace field check box to colour according to a different variable from in the table you have chosen. You will need to enter the minimum and maximum values of the trace field to be displayed in the colour spectrum.
Logarithm
Select this check box to display a trace on a logarithmic scale. Some geophysical traces (i.e. resistivity and induction logs) are displayed on a logarithmic scale, as there is a wide variance in the data.
Average
Select this check box to use a moving average on the geophysical data. You will need to enter the number of samples that will be averaged above and below each sample value.
Width
Enter the width of the window to display the trace in.
Offset
Enter the offset value. This value will determine the distance from the drillhole for the trace to be displayed.
Orientation
Enter the azimuth orientation of the trace in Plan view.
Filled
Select this check box to apply a fill colour to the displayed bar graph. The colour nominated through the Colour field will be used.
Click OK.
Confirm whether or not you want to save the changes to your geophysic.spec file. Use the View Traces option to display the traces.

