Load Desurvey
Load Downhole Survey Data
Use Load Desurvey to load the downhole survey data of any drillhole in the drillhole database so the data can be viewed, edited and reported.
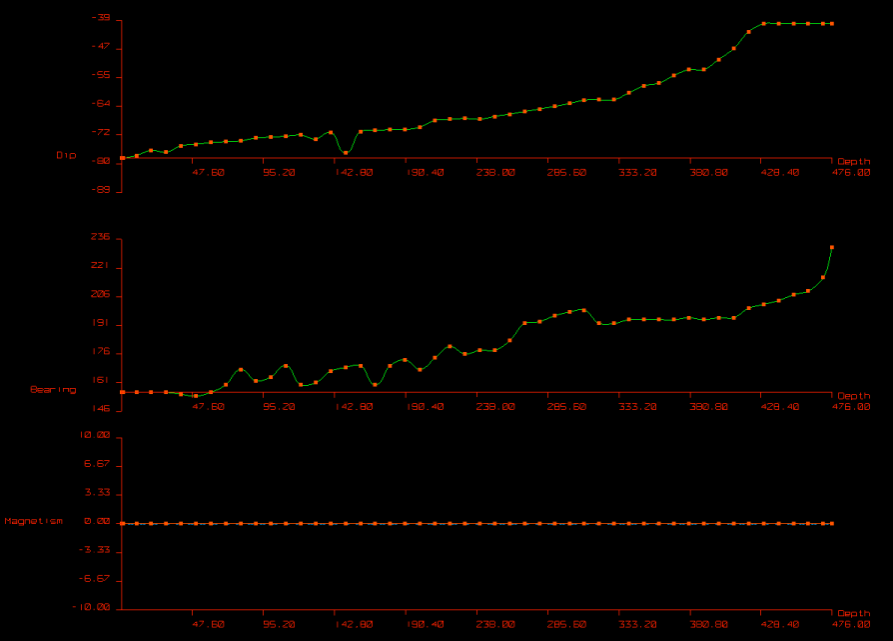
Note: This option loads the downhole survey data in a "smoothing" window and displays plots of depth versus dip, depth versus bearing and depth versus magnetism.
Instructions
On the Geology menu, point to Drilling, and then click Load Desurvey to display the Drillhole Smoothing panel.
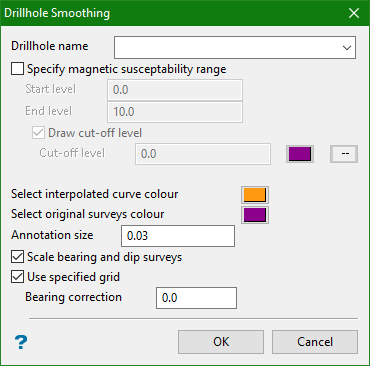
Drillhole name
Enter, or select from the drop-down list, the name of the drillhole that you want to load. The drop-down list displays all drillholes contained in the currently open drillhole database.
Note: Wildcards (* for multiple characters, % for a single character) can also be used.
Specify magnetic susceptibility range
Note: If wildcards are used, then the first hole that satisfies the criteria will be loaded.
Select this check box to display the range of values relating to the magnetic susceptibility that may affect the survey results. We recommend that you do not enable this check box if there is no magnetic susceptibility information recorded with the survey data.
Enable the Draw cut-off level check box to draw a cut-off line on the magnetic susceptibility graph. You will need to specify the required cut-off level, as well as select a colour and line type for the cut-off line. The colour is selected from the current colour table, and the line style (and line thickness) from a list of line types delivered with Vulcan.
Select interpolated curve colour
Select a colour for the interpolated curve of the survey measurements. The colour is selected from the current colour table.
Select original surveys colour
Select a colour for the original survey points. The colour is selected from the current colour table.
Annotation size
Enter the size of the axis annotations in relation to the smoothing window coordinates (scaled font is used).
Scale bearing and dip surveys
Select this check box to adjust the dip and bearing axes to display better the range of values of the survey instruments. If this check box is not enabled, then the dip axis will show a range of approximately 100° and the bearing a range of approximately 190°.
Use specified grid
Select this check box to adjust the bearing measurements by a specified amount. This will be shown on the graphs as well as in any reports that may be generated. If this check box is enabled, then you will need to specify the bearing correction. The bearing correction value refers to the amount that you want to add or subtract from each bearing measurement.
Click OK.
The downhole survey data is then loaded.