Grid Correlation
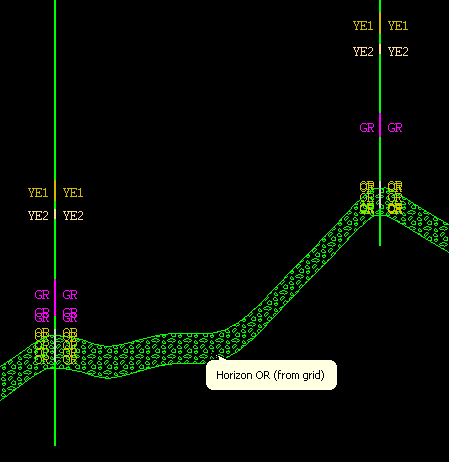
Use the Grid Correlation option to add the trace of one or more grid models to your cross-section. The grid models must exist prior to this option being used. The list of grids for display will come from the currently active horizon list.
Note
- The model(s) are sliced along the section line.
- The tops and bottoms of the grid intervals are connected by a series of triangles. If you have previously selected a default pattern for display, then you will see this pattern shading the triangles that define the horizons.
You can also use this option to display single surface grids in the Section Window.
Instructions
- Select Geology menu
- Select Drilling Section submenu
- Select Grid Correlation option
The following panel displays. If more than one Drill colour scheme is available, then you will be prompted to select the required scheme first.
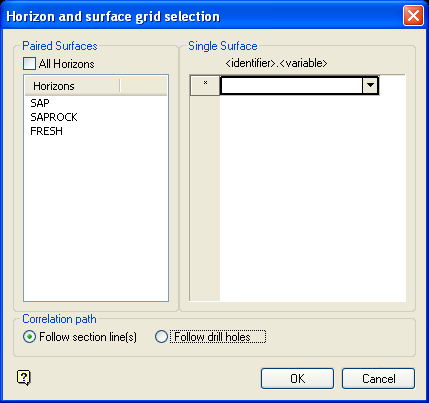
Horizon and surface grid selection
Paired Surfaces
Check the All Horizons check box to report on all horizons (seams) listed. Otherwise, select the horizons on which you want to report.
To select individual horizons, click on the horizon name in the list. To select multiple adjacent horizons, hold down the [Shift] key and click on the names. To select multiple non-adjacent horizons, hold down the [CTRL] key and click on the names.
Single Surface
Enter, or select from the drop-down list, the single surfaces you want to display in the section window. As each row is completed, a new row is added.
Select OK.
The Grid Correlation dialog box is then displayed. Select the required masking mode.
Honour Masks
Select this option to force the masked areas in the grid"s extents to be invisible. Masks allow you to modify the visible area of the grid"s extents.
Do Not Honour Masks
Select this option to ignore the masks on the grid models. The grid models will be visible in all areas in the gridding extents.
After the masking mode is selected, the bores matching the selection criteria will be chosen. The correlations will then be drawn, and any chosen single surfaces displays in the Section Window.
Figure 1 : Grid Correlation