Display Settings 
Use the Display Settings option to configure the display attributes for the drillhole data viewed through the Drillhole Section Window, for example display patterns and settings, trace labelling, patterns for correlations etc. The display settings configured through this option will be saved in your <proj>.gute_spec file. This file, which should not be edited manually, will be stored in your current working directory.
This option can also be accessed by selecting the Default Display Settings button from the Geology Section toolbar.
Note: If you move your geological database without relocating your .gute_spec file, then you will need to reconfigure your display settings.
Instructions
On the Geology menu, point to Drilling Section, then click Display Settings.
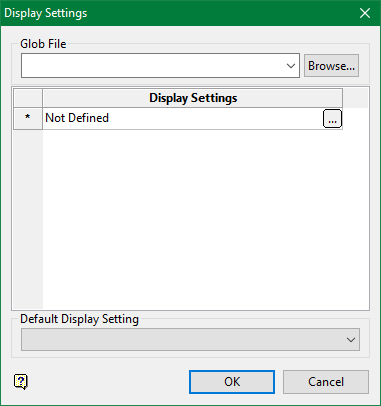
Figure 1 : Display Settings panel
This panel consists of the Display Settings grid and the Default Display Settings drop-down list.
The drop-down list allows you to select the display settings that you want to apply by default whenever viewing data through the Drillhole Section Window. The Display Settings grid lists all existing display settings templates.
To create or edit a display settings template, select the  button. Once selected, the Section Display Preferences panel displays.
Display Settings ID
The name of the display settings template that you are currently modifying displays. To rename the chosen template, enter a new template name and select the OK button. If you are creating a new template, then you will need to assign a template name. The template name will be assigned when you select the OK button.
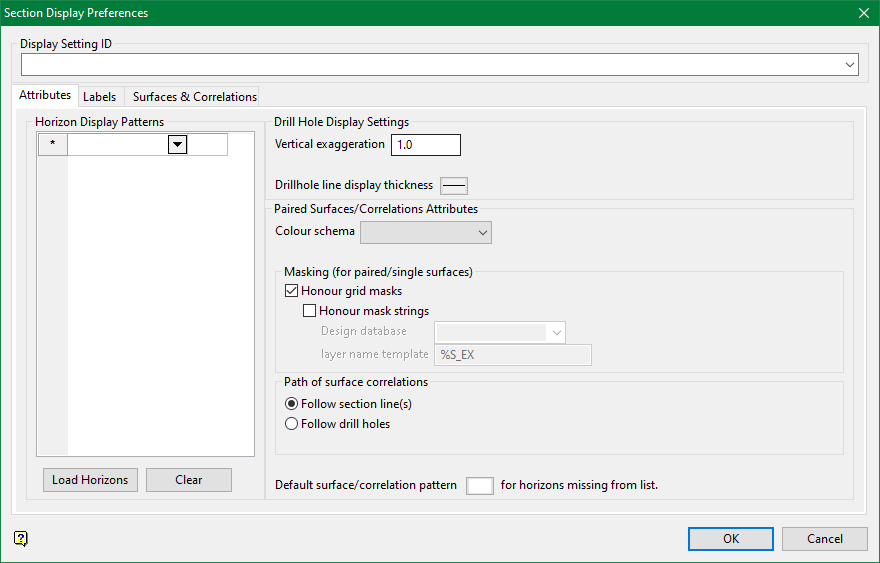
Attributes tab
Horizon Display Patterns
Select the horizon and display pattern that you want to apply when viewed through the Drillhole Section Window. As each row is completed, a new row is added.
Load Horizons
Select this button to load the horizon table (if one exists).
Clear
Select this button to clear the current listing.
Vertical exaggeration
Enter the vertical exaggeration value (multiplying factor) that is to be applied along the Z axis. The exaggeration value contained in your project/job specification file ( .dg1 ) will be used by default.
Drillhole line display thickness
Select the line type that will be used to represent the thickness for the drillhole lines. The line style (and line thickness) is selected from the list of line types delivered with Vulcan.
Colour schema
Select the Drill colour scheme that you want to use when displaying the grids and correlations.
Honour grid masks
Select this check box if you want the masked areas in the grid"s extents to be made invisible. Masks allow you to modify the visible area of the grid"s extents. If this check box is not ticked, then the masks will be ignored and the grid models will be visible in all areas in the grid"s extents.
Follow section line(s)
Select this option to slice the grids along the centreline that defines the section.
Follow holes
Select this option to slice the grids along the line connecting the holes.
Default grid/correlation pattern for horizons missing from list
Select the pattern that will be applied when horizons from the specified listing cannot be found. The pattern is selected from a patterns file.
Labels tab
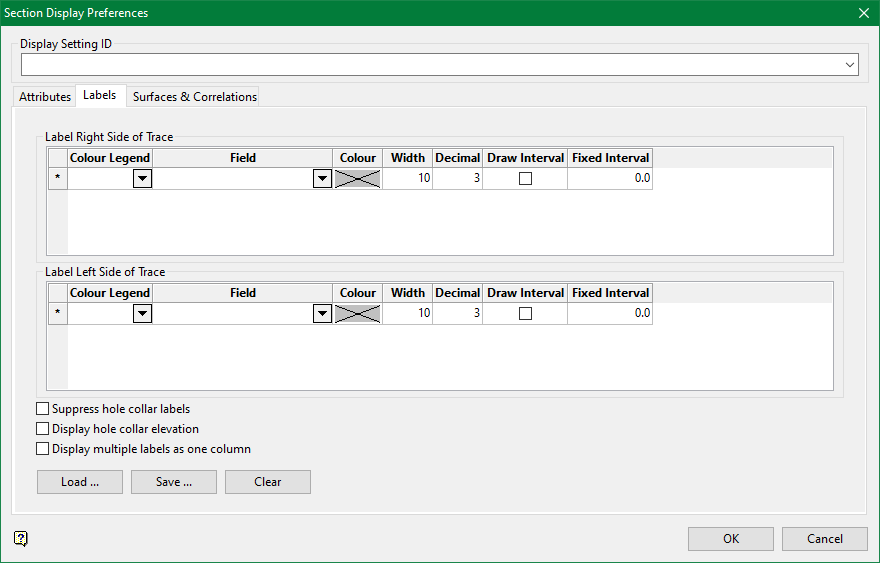
This panel is split into two sections, Label Right Side of Trace and Label Left Side of Trace. The labels for fields selected in the Label Right Side of Trace section will be displayed to the right of the trace and the labels for fields selected in the left section will be displayed on the left.
It is possible to create the labels using three different methods, using the colour legend column, the field and colour column and using both the colour legend and field columns.
Note: It is not required that both the scheme and field columns are used.
Method One - Colour Legend only
The colour legend cell contains a list of all available Drill colour legends. Select a scheme from this list if you want to label the drillhole(s) using one of these colour schemes.
Example: You might use the CU scheme to label the drillhole(s) with the copper assay values. If you do not select a colour, then the colour of the labels will be derived from the scheme.
It is possible to create schemes through the Analyse > Legend Edit > Legend Editor option.
In the following diagram, the AU and CU schemes were used to label the right side of the trace with the LITH scheme being used to label the left side. A colour was not selected from the available Colour field, a width of '10' was used, the number of decimal places was set to '3' and intervals were drawn. The drillhole was displayed on the screen using the AU scheme.
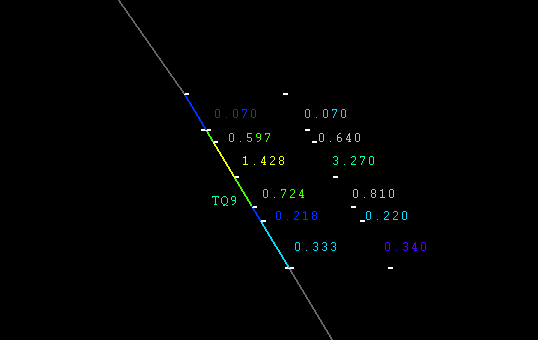
Figure 2 : Scheme Only
Method Two - Field and Colour
The field cell contains a list of all of the fields in the open drillhole database. From this list select the field that you want to label on the drillhole(s). From the colour cell select the colour for the labels. If you don't select a colour, then the label for that field will not be displayed.
Method Three - Colour Legend and Field
If you selected a colour legend and a field, then the drillhole will be labelled with the values from the field, but using the colours from the scheme. Using this method could create labels that are not indicative of the chosen field. The scheme are designed to highlight particular qualities using them to colour fields for which they were not designed could produce misleading or confusing labels.
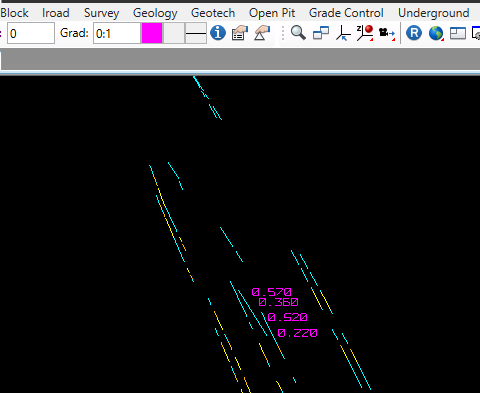
In the following diagram, the AU scheme and ASSAY:CU field were used to label the right side of the trace, with the LITH scheme being used to label the left. A colour was not selected from the available Colour field, a width of '10' was used, the number of decimal places was set to '3' and intervals were drawn. The drillhole was displayed on the screen using the AU scheme.
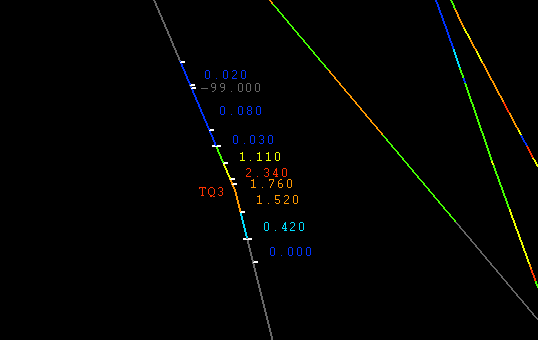
Figure 3 : Schema and Field
Method Four - Field with default colour
If only the field is selected, then whichever colour is chosen in the Status toolbar will be used.
Draw interval
Select this box if you want to display interval markers along the drillhole trace (as shown above).
Fixed interval
This field allows you to specify a fixed depth labelling interval. If a depth is specified, then the drillhole labels will be produced only in increments of this depth.
Note: If the field being labelled is the FROM or TO field, then the actual depth is levelled rather than a value extracted from the database.
Suppress hole collar labels
Select this box if you do not want to display the drillhole collar labels along the drillhole trace. If this check box is not selected, then the drillhole collar labels will be displayed.
Display hole collar elevation
Select this box if you want to display the drillhole collar labels vertically along the drillhole trace. If this check box is not selected, then the drillhole labels will be displayed horizontally.
This option is only applicable when more than one label is displayed on a given side of the trace.
Display multiple labels as one column
The default (when the option is unchecked) is for the labels to display as columns horizontally.
When this option is checked, multiple labels on a given side of the trace displays vertically aligned or stacked.
Load
Use this button if you want to reload previously created label specifications. These specifications are stored within a .mls file. Although it is possible to load specifications from a directory outside of your current working directory, we recommend that you only use specifications that were created for the drillhole data that you are currently using.
Save
Use this button to save the label specifications. You can save the .mls specifications file within any directory, however, we recommend that you save it in the same directory as the drillhole data, i.e. in your current working directory.
Clear
Use this button to clear the panel.
Grids & Correlations tab
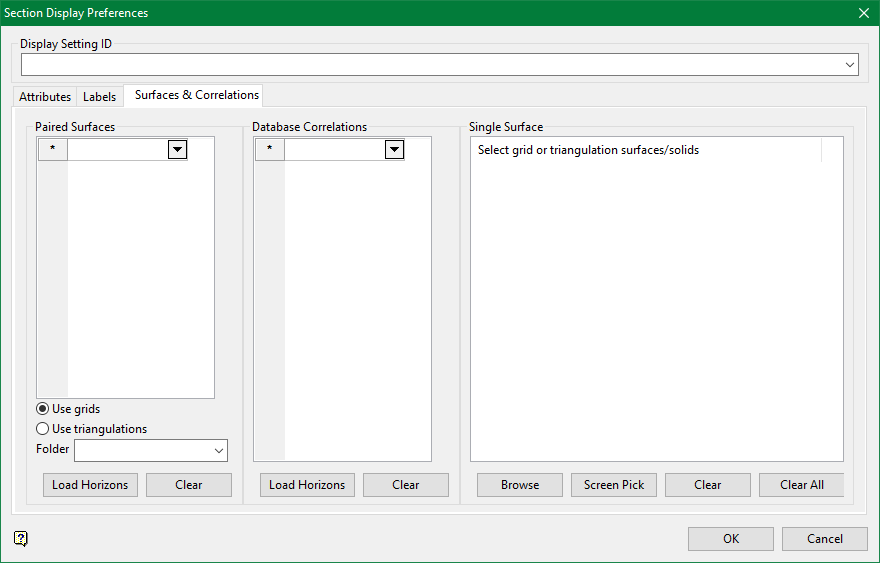
Paired Surfaces
Select the surfaces that you want to apply the chosen colour schema to when viewed through the Drillhole Section Window. As each row is completed, a new row is added.
Database Correlations
Select the surfaces that you want to apply the chosen colour schema to when viewed through the Drillhole Section Window. As each row is completed, a new row is added.
Single Surface
Select the surfaces that you want to apply the chosen colour schema to when viewed through the Drillhole Section Window. As each row is completed, a new row is added.
Load Horizons
Select this button to load the horizon table (if one exists).
Clear
Select this button to clear the current listing.

