Multivariate Transformations
Report
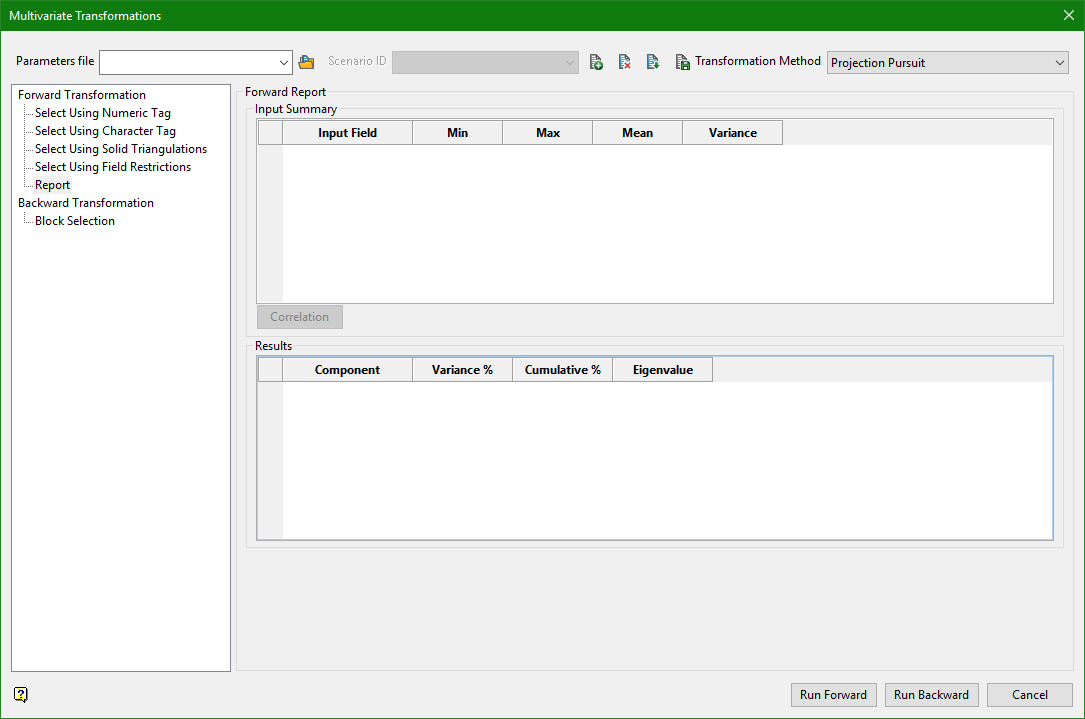
The report tab will contain general information about the input data and the transformation itself.

Input Summary
The input summary contains information on the data that was used to construct the correlation matrix, as well as the correlation matrix itself. This may be used to verify sample selection and to get some basic information.
Input Field
Indicates which field this row refers to.
Min/Max
The minimum and maximum values of this field.
Mean
The mean, or average, value of this field.
Variance
The variance of this field.
Correlation
Click the correlation button to see the correlation matrix of the input data.
Results
The results summary indicates the relative importance of the output principal components. This is only valid for conventional principal component analysis (not using the decorrelate only option).
Component
Indicates which component this row refers to.
Variance %
The percentage of variance described by this particular component. The percentage of variance described by each component decreases in line with the Eigenvalue. This field is simply the scaled Eigenvalue.
Cumulative %
The cumulative percentage explained by this component and those before it. This column may be used to construct a scree plot, or to decide how many components to use. Often a large multivariate system may be described with relatively few components.
Eigenvalue
The eigenvalue from the principal component analysis. These are the eigenvalues from when the correlation matrix is decomposed, and are also the variance of the principal components. Again, this column may be used to construct a scree plot.
Note: In order to use Principal Component Analysis, you must have a database that contains fields for all variables of interest, and fields for all resulting components. These fields need to be in the same table (record). Additionally for minimum maximum auto-correlation factors you will require the point coordinates.

