Pick By Intercept
Use the Pick by Intercept option to pick from a displayed drillhole the intercept for which you want to calculate washability curves. Drillhole data must be displayed on the screen in order to use this option. Database connections and curve specifications must also have been set up.
You can either load drillholes in the usual way using the Drilling menu, or you can use the Load Drillholes option  (under the Geology > Washability Data submenu).
Drillholes can be loaded using any scheme, the tables displayed in the drillhole stick do NOT have to be washability data. The washability data associated with the intercept picked will be located using relational tools according to the rules you specified in the Set Up DB Connections option. However, you will need to have defined at least one set of connection specifications for the datasheet of the drillhole data used.
Instructions
On the Geology menu, point to Washability Data, and then click Pick By Intercept.
The availability of specifications is checked.
Select the desired intercept from the required drillhole by snapping (use the ![]() Snap to Object mode) onto the segment of the displayed hole that represents that intercept.
Snap to Object mode) onto the segment of the displayed hole that represents that intercept.
You may snap either onto the drillhole segment or, if the hole has been labelled, onto the associated text label. Note, however, that in some long holes the alignment of text and line segment can be out of alignment and the intercept picked by using the label can be one or more segments out, if this happens, you will have to pick the line segment.
Having picked the required intercept, it will be highlighted and you will be asked to confirm that it is the correct one.
Once you have accepted the picked segment, the specifications available for thedatasheetof the hole selected are then assessed.
If there are no specifications for this datasheet, then you are informed and the option terminates.
If there is only one set of specifications, then these are used automatically.
If there is more than one, then you are offered a list of available specification names for this datasheet and you must select the one that you want to use.
Washability data will be extracted from the database corresponding to the intercept picked; this may be one-to-one, or there may be several tables corresponding to the drillhole section in question.
If there is more than one set of washability data for the section in question, then the data from all sets is composited by mass weighted averaging for the appropriate amount of the interval covered.
If the intercept picked is only partially represented in length by washability data, then you will be informed of this fact and you will be offered three options:
Continue - ignoring missing data
This option pretends that the missing section(s) of the intercept are not there and weights the existing data for the parts of the intercept represented.
Continue - using default "waste" washability values
This option will only be offered if you have set up waste values as part of the database connection specifications you chose to use for this intercept. Using default values weights the actual data along with the representative amount of the missing data, thus the greater the proportion of the intercept that has no data, the closer the final answer will be to the default values (it doesn't even get this far if there is no data at all covering the intercept).
Cancel and pick another intercept
This option to start again and pick another intercept.
If you select one of the Continue options, then the graph(s) produced will have an indication against the depth range of how you handled the missing data. If you use default waste values, then a line will be added next to the depth range that reads "(No data for a thickness of- waste values used)"; if you ignore missing values, then a line will be added next to the depth range that reads "(No data for a thickness of- ignored)" where
You are then presented with the Curves panel. On this panel you select the variables on which you want to perform washability calculations. The variables listed on this panel are derived from the data specifications that are currently in use.
Variable Name
As mentioned above, the variables listed on this panel are derived from the data specifications currently in use. For example, Ash, Sulfur and Moisture.
Calculate
Check the appropriate check box for each variable on which you want to perform calculations.
Plot
The five columns following the Calculate column relate to the five standard curves that can be plotted from the calculated data columns ( Cumulative Floats Curve, Cumulative Sinks Curve, Relative Density Curve, Instantaneous Variable (for example Ash) Curve, and +/- 0.1RD Envelope Curve ).
Initially, each box is shadowed (i.e. inactive) and it is only possible to select the Calculate boxes. Ticking the check box for a variable, thus indicating that you want to perform calculations on that variable, will automatically activate the plot curve options.
Note: You will not be able to select Plot Cuml. Sinks if no connection to sinks data was established in the connection specifications.
Example
To calculate washability data for the first two variables (Ash and Sulfur) and plot all curves for Ash, but for Sulfur only Cumulative Floats, the entries on the panel would be as follows:
                   Calculate    Cuml.     Cuml.     Rel.    Vari.   +/-
Variable Name                   Float     Sinks     Dens.   Inst.   Dens.
Ash (%)            [x]          [x]       [x]       [x]     [x]     [x]
Sulfur (%)         [x]          [x]
Moist (%)
Note: If you have used these specifications for washability curve calculations, immediately prior to this session, then the panel will remember the options you set from that previous session. For every variable that is calculated, a standard table of washability values is created (as per the ISO standard). This table is created as a text file with the name: <hole_id>_var<variable number>.rep and is incorporated into the curve plot for that variable (if any curves are plotted). You can also create the same table in CSV and/or DMP form. Simply check the appropriate
Note: If you run more than one set of specifications on the same hole, or assess more than one intercept in the same hole, then these files will be overwritten. You may therefore want to rename them after a calculation run to retain these files.
Click OK.
Calculations are then performed for all variables selected and graphs generated for those which have at least one plot made. This can take a while and a message displays informing you that the washability tables and graphs are being calculated.
If any graphs are to be produced, then they are displayed in the Plot Window and the view switches to that window.
You are prompted stay in the Plot Window or return to the original window. Return to the original window and you are back at the stage where you can pick a new intercept.
However, if Interrogate mode is set, then the behaviour is slightly different. You are switched to the Plot Window (if plots were made) and presented with an interrogation panel.
You can query the table(s) you just calculated in three ways:
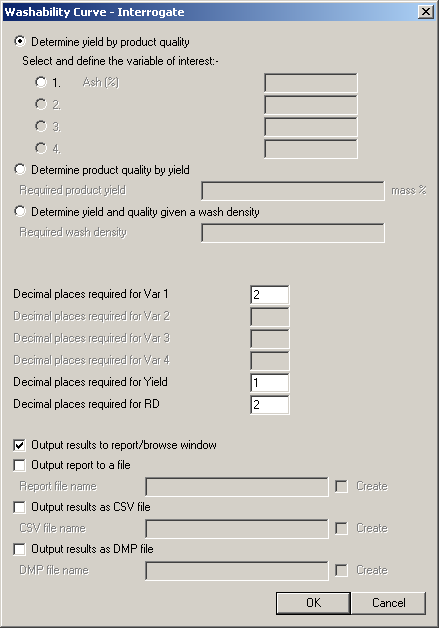
Determine yield by product quality
Selection of this option will result in the options beneath becoming active for as many of the four possible washability values that you have just calculated. Select the option to specify the quality you want to use to determine yield (obviously, you can only determine yield by one quality at a time because they are all auto-correlated). Specify the number of decimal places you require in your report.
It also allows you to specify various ways in which to output the report (these are not mutually exclusive, so you can select as many ways as you like). The default is to output to the a Report/Browse Window. You can also write the identical report out to a file (you can also save the report that displays in the Report Window of Vulcan), or you can output the values in this report to a CSV format file and/or a Vulcan DMP format file (one line per interrogation in both cases).
With the output to a file (report to file, results as CSV, results as DMP) you can force the creation of a file by ticking the Create box. By default it will attempt to append the details to an existing file, only creating it if it does not exist. If a CSV or
Example
To query by an Ash % quality of 12.0% the panel would be filled in as follows:
Determine yield by product quality Select and define the variable of interest: - Ash (%) [12.0] Decimal places required for Qualities 1. [2] 2. [2] Decimal places required for Yield [1] Decimal places required for Yield RD [2] Output results to report/browse window
The result in the Report Window of Vulcan would be:
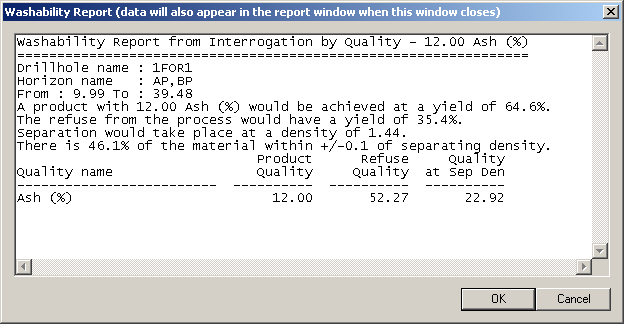
Note: that qualities for ALL of the washability values calculated in this session are made in the table following the initial report. The wording of the report prior to the table is as described in the ISO standard. In the quality table above, the values for Sulfur are identical to Ash because the data values were manipulated for the purpose of demonstration, and identical values have been used for both qualities.
Determine product quality by yield
It might be that you have already fixed a wash plant density because of a required quality (for example Ash %), hence you now know what the yield will be, but you want to find out what the effect of this will be on other quality variables. Select the Determine product quality by yield option. Enter the known yield in the now active Required product yield field. Proceed as above. The report will be a slightly different format with an appropriate heading, but the same values will be reported.
Determine yield and quality given a wash density
If you have already fixed the wash plant density, then you can calculate the yield that will be obtained and quality(ies) of that product. Select the Determine yield and quality given a wash density option. Enter the known density in the now active Required wash density field. Proceed as above. The report will be a slightly different format with an appropriate heading, but the same values will be reported.

