Plot By Area
Use the Plot by Area option to plot a plan of all objects in currently loaded layers.
The generated plot file has the format:
<plot name>.plot
This option can only be selected when in the Plot Edit Window. Use the Toggle Graph Window option to switch between the Plot Window and the original window.
This option does not offer item selection. Therefore, you will need to hide/remove items from the screen if you do want to include them in the resulting plot.
Instructions
On the Geology menu, point to Washability Data, and then click Plot By Area to display the Plot definition panel.
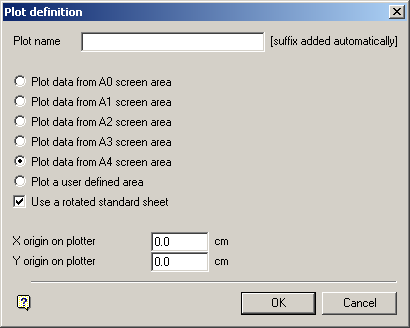
Plot name
Enter the name for the plot file to be generated. The resulting plot file will be placed in your current working directory. If the specified plot file already exists, then you will be asked whether or not you want to replace it, i.e. overwrite the "original" data.
The area to be plotted can be any area bounded by the A0 to A4 sheet templates. If you want to plot a different area, then select the Plot a user defined area option. This will allow you to draw a rubber band rectangle around the area to be plotted. Defining the area yourself may be useful to make a plot that is bigger than the largest plot area available to your plotter. The plot can be made in separate sections by defining the rubber band over each section in turn. If you use construction points, or type in coordinates for the corners of the rubber banded box, then you can get exact registration at the edges of the separate plots.
Use a rotated standard sheet
Select this check box to rotate the sheet, i.e. portrait rather than landscape. This option is only applicable when plotting from a standard sheet template (i.e. A0, A1, A2, A3 and A4).
X/Y origin on plotter
This section allows you to specify the origin position on the plotter.
Click OK.
You will then be asked whether or not you want to preview the plot. If you choose to preview the plot, then the plot displays in the Plot Preview Window. If you choose not to preview the plot, then the plot file name displays.

