Plot Report
Use the Plot Report option to plot (individually) the washability graphs that you have generated. These can be graphs that you have just generated, or ones that have been generated and saved from a previous session.
Note: You must be in the Plot Application to use this option, and the graphs must be displayed.

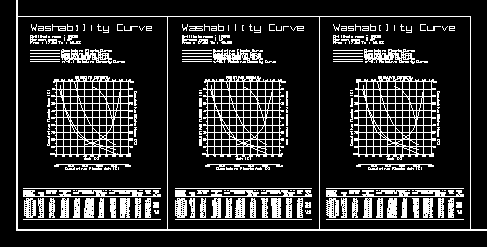
Figure 1 : Washability graphs
Instructions
On the Geology menu, point to Washability Data, and then click Plot Report.
Select the washability curve report to plot (by clicking any object in the report).
The Wash plot name panel is then displayed. This allows you to allocate a name for the plot file. By default the name is the report"s layer name with a. plot extension. For example, WC_000002.PLOT
Once you have named the plot file, the plot generation continues as usual (refer to the File > Plot documentation). When successfully completed, the report plotted will be shadowed.

Figure 2 : Plotted Washability graph (shadowed)

