Query Graph
The Query Graph option allows you perform ISO standard queries of product quality from the graph reports generated and loaded in the Plot Window.
You might use this option when you have not set the interrogate mode (see Set Interrogation Mode option), or wanted to perform the queries only after you have generated all of the reports, or wanted to perform some further queries that you did not do from the interrogate mode pass. The queries you can perform this way are similar to those you do in interrogate mode queries, but you have an extra option to query single curve intercepts as unrelated graphs.
Instructions
On the Geology menu, point to Washability Data, and then click Query Graph.
Select the graph to interrogate by picking on any part of the washability graph report.
The following panel is then displayed.
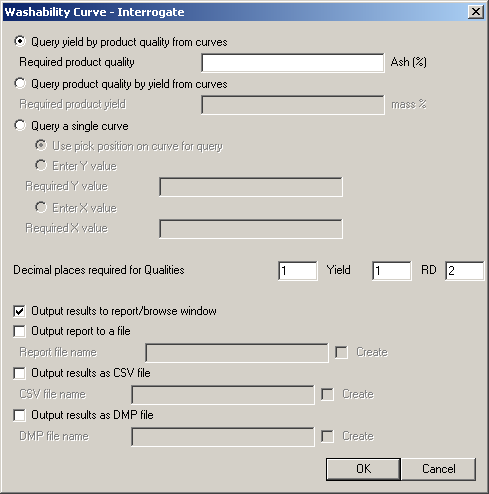
You can query this report in three ways:
Query yield by product quality from the curves
With selection of this option you will need to enter the required product quality and specify the number of decimal places you require in your report.
It also allows you to specify various ways in which to output the report (these are not mutually exclusive, so you can select as many ways as you like). The default is to output to the Report Window of Vulcan. You can also write the identical report out to a file (you can also save the report through Report Window).
You can also output the values in this report to a CSV format file and/or a Vulcan DMP format file (one line per interrogation in both cases).
With the output to a file (report to file, results as CSV, results as DMP) you can force the creation of a file by ticking the Create check box. By default it will attempt to append the details to an existing file, only creating it if it does not exist. If a CSV or
The following report would be produced in the Report Window if you were querying by an Ash % quality of 12.0%.
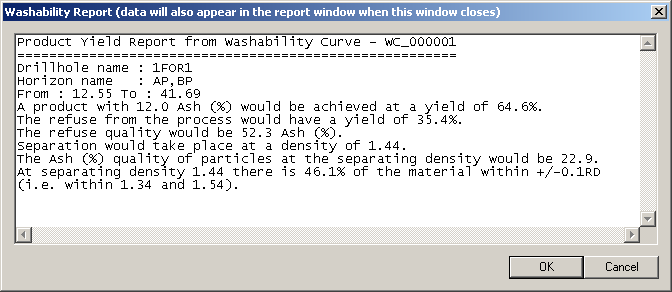
Figure 1 : Product Yield Report from Washability Curve
The wording of this report is as described in the ISO standard.
Query product quality by yield from curves
It might be that you have already fixed a wash plant density because of a required quality (for example Ash %), hence you now know what the yield will be, but you want to find out what the effect of this will be on another quality variable. Select the Query product quality by yield from curves option.
Enter the known yield in the now active Required product yield field. Proceed as above. The report will be a slightly different format with an appropriate heading, but the same values will be reported.
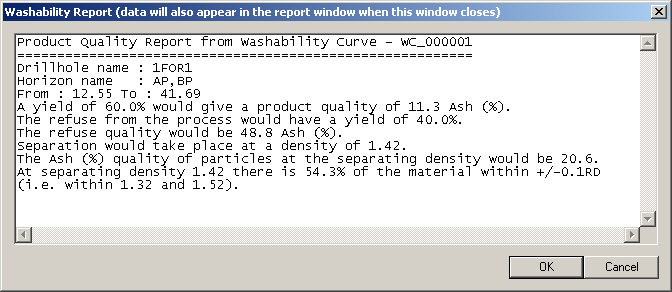
Figure 2 : Product Yield Report from Washability Curve
Here we have queried the product quality given a known yield of 60%. Our quality here was Ash%, which is reported to have a quality of 11.3% at that yield.
Query a single curve
You can either pick a position on a curve and it will report the X an Y values at the intercept, or nominate a wanted X or Y value then pick the curve on the report. You must only pick on a curve line on your nominated report.
The values are only reported in the Report Window. There is no option to output these values to CSV or DMP files, and these check boxes are shadowed when this option is used.

