Set Up Curve
Use the Set Up Curve option to set up the specifications that tell the Washability Curve software the page size and plot defaults to use for producing the washability curve output.
Note It is not necessary to change any of these settings. The system will default to an A4 page size (with character sizes set to match). Colours will all default to white, which is colour number 32 on the standard (hard coded) colour table. If the colours have been altered, then it will be whatever is currently defined as colour 32. White is chosen as the default colour as it will convert to black on a colour printer/plotter.When this option is run, it creates a specification file that resides in a subdirectory of the project directory called wash_curve. The wash_curve subdirectory will be created automatically the first time it is needed
The format of the file name is:
wash_graph.grsp
and there is only one in the directory.
Instructions
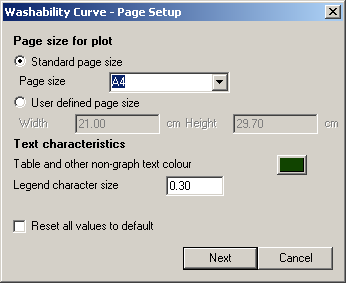
On the Geology menu, point to Washability Data, and then click Set Up Curve to display the Washability Curve - Page Setup panel.

Standard page size
Select this option to use a standard paper size. The character sizes used will automatically be adjusted to fit. There are two standard page sizes set in the system, A4 and US Letter. These can be picked from the drop-down list.
User defined page size
Select this option to define your own paper size. You will need to set all of the non-auto character sizes to ensure that they fit.
Note: All sizes in the Setup Curve panels are in centimetres (even if you select US Letter as the page size).
Text characteristics
Table and other non-graph text colour
Select the colour for the parts of the plot that are not in the graph group. The colour is selected from the current colour table.
Legend character size
Enter the size of the text that you want to use for the legend above the graph (see the Overview for an example). Both the title text and the text for the washability table will be automatically sized to fit the page width.
Reset all values to default
Select this check box to restore the default curve specifications without having to edit everything. Confirmation is required before everything will be reset. Once confirmed, all settings are restored and the panel is redisplayed.
Click OK.
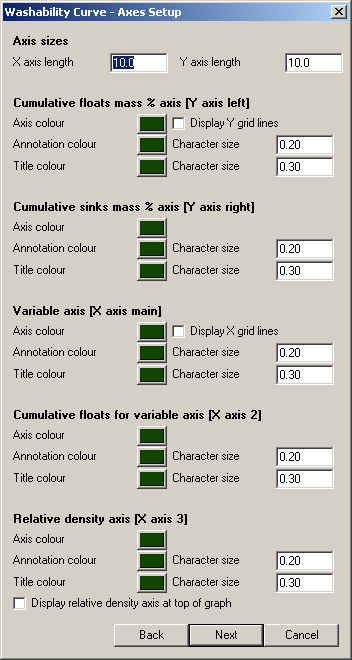
The following panel is then displayed (assuming that the Reset all values to default check box was not selected).

The ISO standard washability curve has 5 axes on the same graph; three X axes and two Y axes.
This panel allows you to define their characteristics. From the sizes of the axes, the colour of the individual axes, to the colours and sizes of the title and annotation text on the axes. You can choose to display (or not) both X and Y grid lines. The ISO standard graph can either have the Relative density axis displayed at the bottom of the graph, or on the top as in the example shown in the Overview .
Click OK.
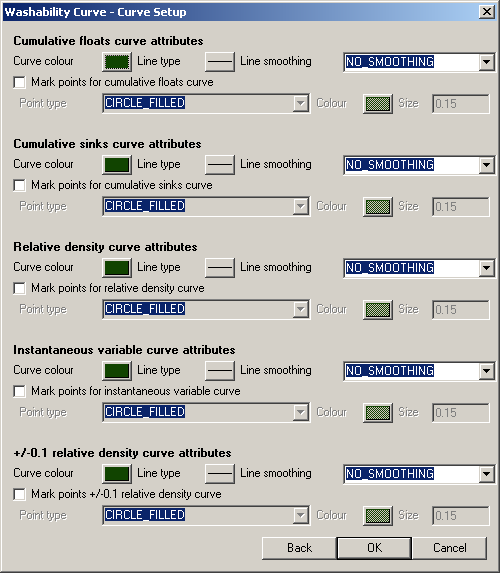
The following panel is then displayed.

This panel allows you to define the graphical attributes for the curves.
There are 5 curves drawn on the ISO standard washability graph. This allows you to change the graphical attributes of the lines and points used to mark each curve.
Curve colour
Select a colour for the curve. The curve colour is selected from the current colour table.
Line type
Select a line type for the curve. The line type (and line thickness) is selected from a list of line types delivered with Vulcan.
Line smoothing
There are 3 methods of smoothing that can be selected from the drop-down list.
The methods are:
- NO_SMOOTHINGThis will just draw straight-line segments between each point on the graph.
- SPLINE
This puts a bicubic spline between all points in the line. - BLENDED_POLYThis puts a blended polynomial curve between each group of three points in the curve.
For most situations, the visual effects of SPLINE and BLENDED_POLY will be very similar. The
Mark points
Select this check box to place markers for the data points along the curves. You will need to specify the point type, colour and size for the points.
Click OK.

