Set Up Multiple Rose Diagrams
Set the display defaults for multiple Rose Diagrams
The Set Up Multiple Rose Diagrams option to specify the defaults for displaying multiple Rose Diagrams.
Instructions
- Select Geotech menu
- Select Display submenu
- Select Set Up Multiple Rose Diagrams option
The following panel displays.
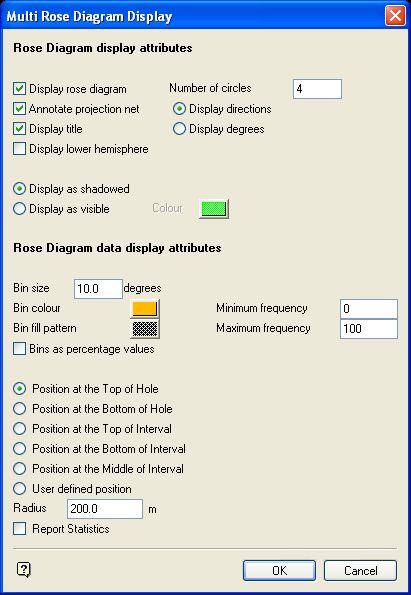
Multi Rose Diagram Display panel
Rose Diagram display attributes
Display rose diagram
Select this check box to display the projection net. You will need to enter the number of concentric circles in the diagram. These circles aid in determining the size of each data bin.
Annotate projection net
Select this check box to annotate the edges of the Rose Diagrams with either degrees, or with compass style directions. The annotations are in scalable fonts, and therefore can be changed (i.e. re-scalable) using the regular Vulcan text editing options.
Display title
Select this check box to display the title of each Rose Diagram.
Display directions
Select this option to display the cardinal directions around the diagram.
Display degrees
Select this option to display net notches at the same interval set for bin size.
Display lower hemisphere
Select this check box when displaying the structural data on the Rose Diagrams as 3D vectors (see the Load To 3D option). Note that only one lower hemisphere will be generated.
The drillhole load sequence will determine which drillhole displays the lower hemisphere. This could cause the hemisphere to be placed in a different drillhole than expected. To circumvent this issue, when using this option always load the Multiple Rose diagram using a 2D polygon .
Note: The 2D polygon used to load the Multiple Rose diagram MUST be created before the Load To Multiple Rose option is invoked.
The Rose diagrams can be shadowed, or displayed in a specified colour. The colour is selected from the current colour table.
Rose Diagram data display attributes
Bin size
This relates to how the dip direction values are divided up by the data bins. Each bin is a bar projecting from the centre of the Rose Diagram. The length of each bin denotes how many structures have a dip direction value in the range for that bin. This may also be expressed in terms of percentages if the Bins as percentage values check box is ticked.
Bin colour/fill pattern
Select the required colour and pattern for the bins.
Minimum frequency
Enter the frequency at the centre of the Rose Diagram.
Maximum frequency
Enter the frequency found at the outer circle of the Rose Diagram. Bins are clipped to the outer circle if their frequencies exceed the maximum.
Position
Specify the position of the Rose Diagrams. The diagrams can be positioned at either the top or bottom of a hole, or at the top, middle or bottom of an interval. Select the User defined position option to manually indicate the position at which to place the rose diagrams.
Radius
Enter the size of the Rose Diagrams.
Report Statistics
Select this check box to report statistics for each loaded Rose Diagram. If this check box is ticked, then the following values displays in the Report Window:
- Site ID
- Total number of values found
- Minimum/Maximum value
- Minimum/Maximum percentage
Select OK.
The Rose Diagram display net is then shown.
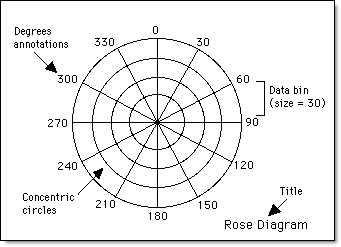
Figure 1 : Rose Diagram Setup
The above diagram shows some of the elements of a Rose Diagram. Distributions of the dip direction values are displayed in the various ranges. These ranges are set at 30-degree intervals, with 4 concentric circles, degree values and titles as annotations.

