Generate Plans
Generate Plot Files
The Generate Plans option to generate a plot file and a plot script file. The latter is used to send the plot file to a plotter.The plot file can be generated following one of three styles (drill, charge, tie-in). The naming conventions for these files are, respectively, as follows:
<bench number><deposit>_<blast number>_dp.00p_plot
<bench number><deposit>_<blast number>_cs.00p_plot
<bench number><deposit>_<blast number>_ti.00p_plot
The corresponding script files have the file extension
.csh
.
Note This option requires that corresponding title block and border styles, named '
DRILL_PLAN
', '
CHARGE_UP
' and '
TIE_IN
', are defined in your drafting style database. Refer to the Drafting Sheets documentation in the File > Plot Templates section for more information. You will also need to ensure that you have nominated to use a defined title block and border style. If this has been specified, then the default title block and border style will be used for the resulting plots. Refer to the Plot All section of the Tools > Preferences option for more information.
Instructions
- Select Open Pit menu
- Select Explosive Analysis submenu
- Select Generate Plans option
The following panel displays.
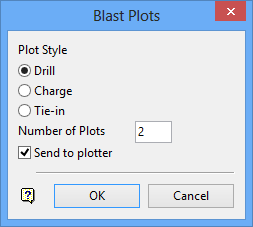
Blast Plots panel
The type of plot can be Drill, charge or tie-in. Each type corresponds to a plot layout and title block designed especially for the plot use, that is, different information may be required in the title block etc.
Number of Plots
Enter the number of plots (a default value of 2).
Send to plotter
Select this check box to send the plot file to the plotter once it has been generated.
Select OK.
The following panel is then displayed.
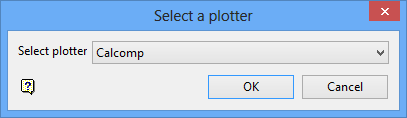
Select a plotter panel
This panel lists the plotters to which Vulcan generated plots can be directed. Select a plotter from the drop-down list.
Select OK.
Vulcan will check whether a user defined style is required (specified through the Plot All section of the Tools > Preferences option).
The following panel is then displayed.
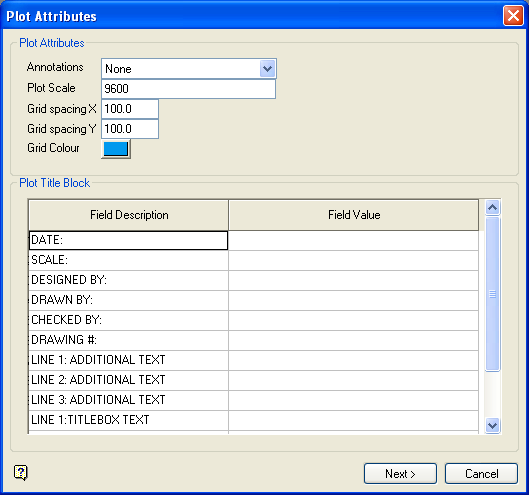
Plot Attributes panel
Annotations
Select from the drop-down list one of the following options:
-
No annotations
Results in no grid or grid annotations being included in the plan. The two grid spacing options below will be disabled when using this option. -
Annotations with crosses
Results in grid value annotations (as above) plus crosses at each grid intersection point. -
Annotations with lines
Results in full grid lines with annotations. -
Annotations without crosses or lines
Results in only grid value annotations.
Plot Scale
Enter the scale to be used. The number must be between 1 and 999 999 999 999. The default scale is derived from the plot defaults.
For example: If the scale was 1:1250, then a 1 cm object on the plot would be 1250 units in the real world.
Grid spacing
Enter the grid spacing for both the X and Y (or East and North respectively) axes. The default spacing is derived from the plot defaults.
The unit of measure refers to the unit set (through the View > Windows > Create option) for the current window.
Grid Colour
Select a colour for the grid. The colour is selected from the current colour table. Use the
![]() Grid Properties icon or the Analyse > Grid > Apply option to display the grids on the screen.
Grid Properties icon or the Analyse > Grid > Apply option to display the grids on the screen.
Plot Title Block
This section lists the definable components of the plot's title block. The fields displayed through this section correspond to the chosen drafting sheet. Refer to the following table for a list of supported plotting variables which can be entered in the Field Value column.
| Variable | Text Plotted |
|---|---|
| %SCALE% | Scale |
| %DATE% | Date |
Select OK.
You will then be prompted to indicate the origin. Click and hold down the mouse in the position where you want the origin of the plot to be located. A white rectangle will appear. Drag this rectangle until you are satisfied with the location of the origin - the origin will be at the lower left hand corner of the rectangle.
The following panel is then displayed.
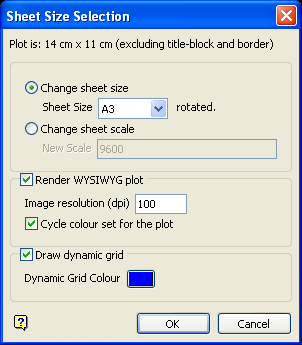
Sheet Size Selection panel
This panel allows you to select a paper size from the various paper sizes on which plots may be printed. It also shows the size of the current plan (determined by the Scale option in the Plot Attributes panel). Based on this size the system suggests the appropriate paper. A message is displayed if the size is too big. You can then either change the sheet scale or overwrite the message by selecting any sheet from the panel (the latter is used for continuous paper).
The available paper sizes are set in the drafting database for user-defined title blocks. Refer to the Drafting Sheets documentation for more information.
Render WYSIWYG plot
Select this check box if you want to generate a scaled image plot. WYSIWYG ( W hat Y ou S ee I s W hat Y ou G et) means that the objects in your plot will appear the same as they did on the screen. This means that you can include underlays in the plot. However, as the plot is of an image, you may notice inconsistencies as you zoom in and out of the plot.
Image resolution (DPI)
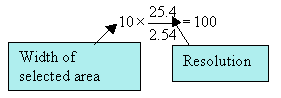
Specify the resolution (in dots per inch) of the image that will be generated and placed in the plot file. Take into account your paper size selection when choosing an image resolution. A general rule of thumb is to try to have the image width, in pixels, the same number as the width, in millimetres, of the selected area.
For example: If your selected area is 10cm (100mm) wide, then you want the number of pixels to be 100, so the resolution should be 25.
It is possible to have pixels spread over a greater width, that is one pixel for every 4 mm, however, you maybe disappointed with the final result. It is also possible to have more pixels per millimetre, i.e. 4 pixels for every 1 mm, however, this may use too much memory and the plot may not be printed. To achieve the best results with your printer, experiment with different resolution settings.
Cycle colours set for the plot
Select this check box if you want to toggle between your standard and alternate colour sets for the duration of the plot. Standard and alternate colour sets are defined through the Graphics : Colours section of the Tools > Preferences option. Since a true WYSIWYG image is created, we recommend that you use a light coloured background.
Draw dynamic grid
Select this check box if you want to draw the dynamic grid on the plot. Dynamic grids are grids displayed on the screen via the
 Grid Properties icon or the Analyse > Grid > Apply option.
Select a colour for the dynamic grid. The colour is selected from the current colour table.
Note
- The Render WYSIWYG plot check box, Image resolution field and Cycle colours set for the plot check box will be disabled, i.e. unavailable, when manually selecting the data to plot, i.e. the Select items to plot option (on the Create Plot panel) was chosen.
- If the image resolution is set too high, then the resulting plot may be too large. It is also of little value to set the DPI higher than the resolution available on your printer.
- If a WYSIWYG plot is being performed, then any grid on the screen will be displayed as part of the screen dump even if no option to create a grid on the plot is selected from the plotting panel. If you do not want for a grid to be displayed in the resulting plot, then you must first turn off the grid screen display before running a WYSIWYG plot.
Select OK.
The plot file is then generated. Upon completion, you will be asked whether or not you want to preview the plot.
Don't Preview displays the plot file name in the middle of the screen. Preview Plot displays the plot file name and posts the plot to the screen for a preview.

