Increment
Create Increments from Mining Blocks
The Increment option to create increments from mining blocks across benches. The mining blocks must have been named (refer to the Numbers option).
Increments are groups of blocks that are exposed at the same time during the life of the pit.
Example: An increment may contain all the blocks that will be mined from the pit in October 1995. An increment relates therefore to a scheduling period.
Several increment scheme (plans) can be defined for each pit. Reserves can be calculated as the increments are created and can be saved to a report file or put on the screen as a graph.
Note: No increments need to be created if you generate reserves for input into the Vulcan/Scheduler program.
Instructions
On the Open Pit menu, point to Increment Design, and then click Increment option
The following panel displays.
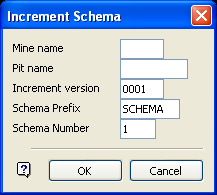
Increment Schema panel
The details on this panel will be used in the reporting.
Mine name
Enter the name of the mine to which the increments relate. The maximum size is 4 alphanumeric characters.
Pit name
Enter pit to which the increments relate. The maximum size is 8 alphanumeric characters.
Increment version
As several increment versions may exist, you will need to supply the version number of the one currently being created.
Example: For an increment that represents the period Sept95, you may have created an initial plan and later some more updated plans. The first initial plan would be version 0001 , and each subsequent plan incremented with one, that is, 0002, 0003 etc.
Note: The Mine name, Pit name and Increment version are stored in the description of the increment layer (see Schema Prefix below).
Schema Prefix/Number
Enter the layer name into which an increment is stored. This name consists of a prefix and a number ( <prefix><n> ).
Example: Sept95 . The maximum size of the prefix is 5 alphanumeric characters, the maximum number is 99.
Select OK.
The following panel displays.
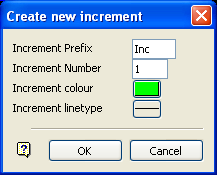
Create new increment panel
Increment Prefix/Number
Enter the increment name, which consists of a prefix and a number, For example, INC01. The maximum size of the prefix is 8 alphanumeric characters, the maximum number is 99.
The group name of each of the blocks changes to the increment name.
| Increment Name | Increment Version | Increment Layer |
| INC1 | 0001 | Sept95 |
| 0002 | Sept95 | |
| 0003 | Sept95 | |
| INC2 | 0001 | Sept95 |
| 0002 | Sept95 |
INC1 and INC2 relate to the same period. If they did not relate to the same period, then a different layer would have been created.
Increment colour/linetype
Select the colour and line type for the increment.
Note: Increments can have different colours and line types to differentiate between them. The increments created are stored in the layer nominated previously.
Select OK.
The Increment Design dialog box is then displayed.
New Increment
Select this option to create a new increment. The Create new increment panel will be redisplayed.
Add Block
Select this option to add a mining block to the current increment (the one defined on the Create New Increment panel). You will be prompted to select the block and the selection must be confirmed. Upon confirmation, the Increment Design dialog box is redisplayed so that the next block can be added.
Note: The blocks do not need to be adjacent or on the same benches. As the increment is built, reserves can be calculated for the increment - see View Details. Once all blocks for the increment are selected, a new increment can be defined.
Undo
Select this option to exit the option. All increment steps created since selecting the option will be removed.
View Details
Select this option to perform a reserve calculation on the increments currently created. Once selected, the Reserve Computation panel displays. If no block model is open, then you will first be prompted to open one before this panel displays.
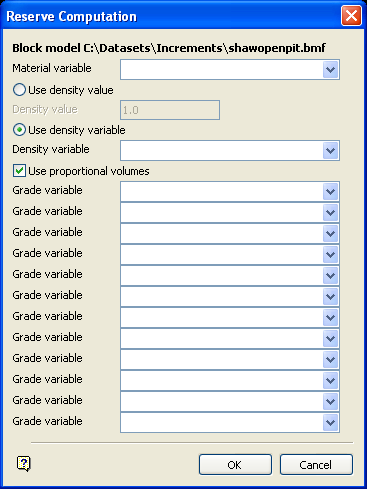
Select the material variable, which is a 'non grade' variable, used to break down the reserves report by material or geology codes stored in the block model. The density used for calculations can be specified directly or derived from a field in the block model.
Check the Use proportional volumes check box if you want to ensure that block model cells, which are only partly inside the scheduling block, have their volumes reduced by that proportion. If this check box is not checked, then the full volumes are incorporated in the calculations.
You will also need to specify the grade variable fields in the block model that contain the grade information.
Example: fe, au, zn.
Up to 12 grade variables can be specified.
Select OK to proceed.
If grade values equal a default grade after grade estimation, then a panel listing the variables involved and the actions to take is displayed. You can choose to Use Average or to Use Default values. It is possible to enter a value for the default.
Select OK to process the blocks. Progress messages are then displayed in the status bar. The process can be stopped at any time by pressing [Esc].
The following panel is then displayed.
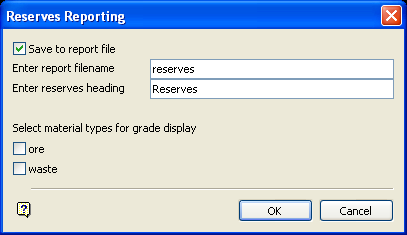
Check the Save to report file check box to save the reserves report in a nominated file ( .rrf ). The full filename is <proj><name>.rrf. The resulting report file can be imported into a layer through using the Report File option.
You will need to enter the report heading, which displays at the top of the report, and check the check boxes preceding the material type which require grades to be represented. The materials displayed are derived from the block model.
Select OK.
The reserves report is then displayed in the Report Window.
The following panel is then displayed.
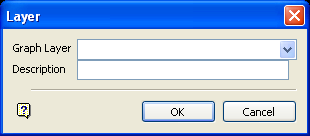
Select the layer that will be used to store the graph.
To create a new layer, enter the layer name. The layer name:
- may contain up to 40 characters.
- must begin with an alphanumeric character [0-9] or [a-z].
- cannot include spaces.
- can include hyphens [ - ], plus signs [ + ], underscores [ _ ], periods/dots [. ].
- can include the special characters of ÁÂÃÀÇÉÊÍÓÔÕÚÜÑ that are used in the Spanish and Portuguese languages.
Enter a description to further describe the contents of this layer. The description can be up to 80 alphanumeric characters and may include spaces. If a description is not entered, then a default description will be used instead. If the chosen layer already has an assigned description, the description displays when the layer is selected. Existing layer descriptions can be overwritten.
Select OK.
The following panel is then displayed.
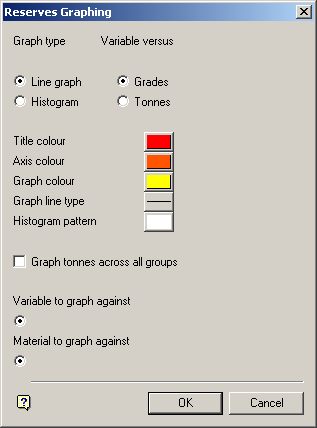
This panel relates to the graph format for displaying reserves for the currently selected increments.
Graph type
The graph can either be a line graph or histogram. The line graph produces a single line joining coordinate pairs on the graph. The histogram produces shaded bars for each item on the X axis.
If the Graph tonnes across all groups check box is checked, then all other options on the panel are shadowed. Uncheck the option to select differently.
Variable versus
The variable can be plotted against Grades or Tonnes.
Grades
Selecting grades produces a graph of individual block names along the X axis and grade values along the Y axis. The grade values are the grades of one grade variable, (chosen from the Variable to graph against list), in one material type, (chosen from the Material to graph against list), for each block.
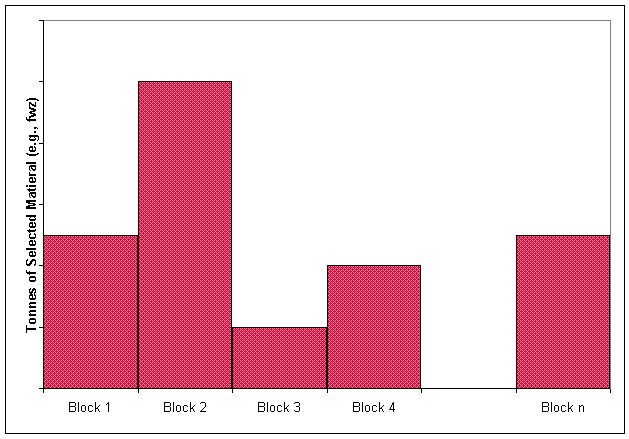
Tonnes
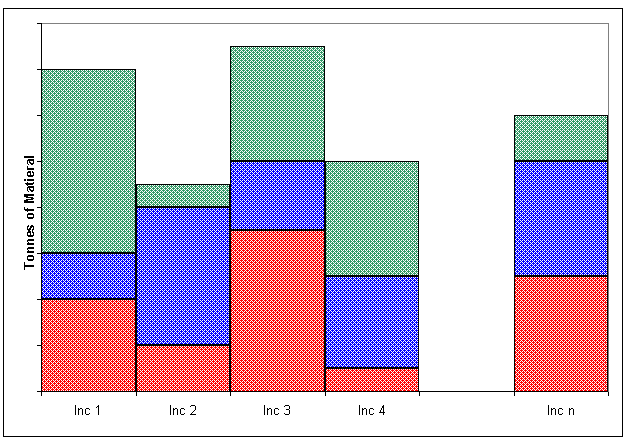
Selecting tonnes produces a plot of individual block names along the X axis and tonnes in one material type, (chosen from the Material to graph against list), along the Y axis.
Title colour/Axis colour/Graph colour/Graph linetype/Histogram pattern
Select the display characteristics of the graphs.
Check the Graph tonnes across all groups check box if you want to plot all increment groups along the X axis and tonnage along the Y axis. The graph is a stacked histogram of tonnages of all defined material types in each increment group.
Select OK to proceed.
You will be prompted to indicate the graph origin, that is,,the start of the box in which the graph displays. You will also be asked to indicate the extent, that is,, the end of the box. The size of the box determines the graph size.
Once the box has been drawn, the graph displays and you are returned to the Reserves Computing panel. Select Cancel to exit.
Note: The view MUST be set to Plan view to display the graph.

