Graph
Display Graphs of Reserves
The Graph option to display graphs of the last calculated reserves. The graphs can be line graphs or histograms, grades or tonnages and can be inside or across geological and material boundaries.
Note: You must be in Plan View to display graphs.
Instructions
On the Open Pit menu, point to Increment Design, and then click Graph option
The following panel displays.
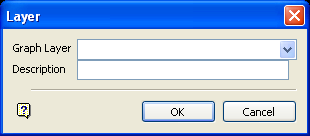
Layer panel
Graph Layer
Select the layer that will be used to store the graph.
To create a new layer, enter the layer name. The layer name:
- may contain up to 40 characters.
- must begin with an alphanumeric character [0-9] or [a-z].
- cannot include spaces.
- can include hyphens [ - ], plus signs [ + ], underscores [ _ ], periods/dots [. ].
- can include the special characters of ÁÂÃÀÇÉÊÍÓÔÕÚÜÑ that are used in the Spanish and Portuguese languages.
Description
Enter a description to further describe the contents of this layer. The description can be up to 80 alphanumeric characters and may include spaces. If a description is not entered, then a default description will be used instead. If the chosen layer already has an assigned description, the description displays when the layer is selected. Existing layer descriptions can be overwritten.
Select OK.
The following panel is then displayed.
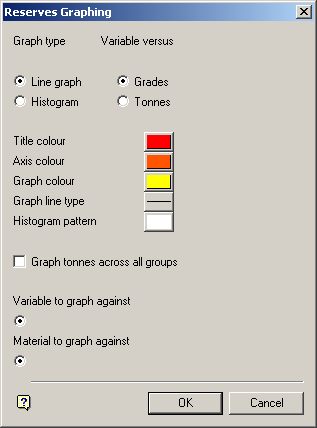
Reserves Graph panel
Refer to the Increments option for an explanation of this panel.

