Display Settings
Set Display Parameters
The Display Settings option to set display parameters for the currently selected monitor time periods. The display parameters include parameters for the monitor path trace (or trajectory), the overall direction vector and sample points.
If a number of mappings exists (see the Data Mapping option), then you must first go to Data Mapping and select the mapping name you want.
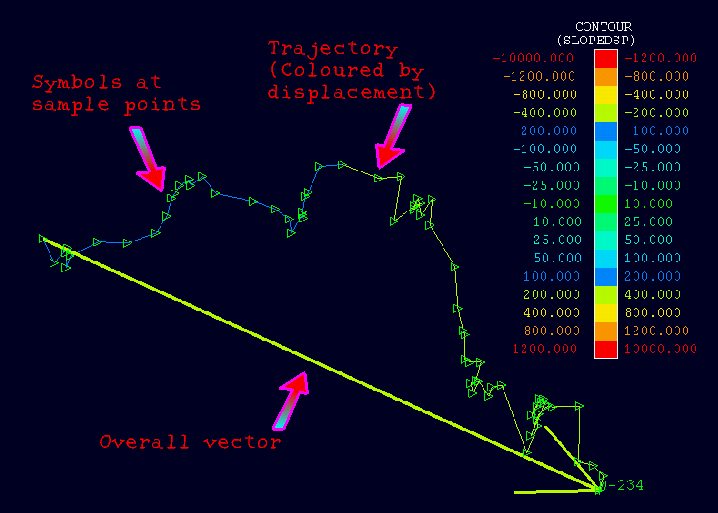
Diagram 1 - Result of Display Parameter Settings
Instructions
- Select Open Pit menu
- Select Monitoring submenu
- Select Display Settings option
The following panel displays.
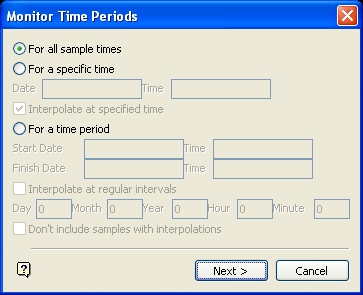
Monitor Time Periods panel
Display parameters can either be set for all sample times, a specific time or for a time period (range).
We recommend that the monitor for all sample times is loaded first, which you can study and decide on the specific time you want to load. We also recommend that the loaded monitor is identified to ensure that the times are correctly loaded. When you load all sample times, identify using all sample times.
If you select For a time period and check the Interpolate at regular intervals check box, then you must specify a day and hour value. Otherwise, no interpolation occurs.
The date and time can be entered in any of the supported formats .
All entries in the Monitor Time Periods panel are stored in the
<proj>.mon_spec
file as:
BEGIN$TAB GENERAL ' ' ' ' ' ' END$TAB GENERAL
Select Next.
The following panel is then displayed.
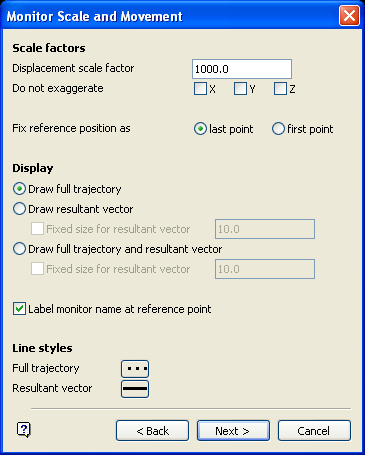
Monitor Scale and Movement panel
This panel to exaggerate spatial information, as well as select which movements are to be displayed.
Scale factors
Spatial information can be exaggerated, at a specified factor, according to a fixed reference position placed at either the last or first point. Displacement scale factors are used so small monitor movements, such as millimetres, can be viewed at the same scale as the coordinates (easting, northing and elevation) of the monitors. In general terms, a factor between 300 and 400 should be sufficient for movements around 1-10 millimetres. For prisms and wire extensometers , the reference point can be the first point.
Display movement
The trajectory, resultant vector or both can be displayed. We recommend that you load both the full trajectory and resultant vector the first time. However, loading both for a large number of monitors will slow the system down.
Label monitor name at reference point
Select this check box to label the monitor at the reference point with its name.
Line styles
A line type can be selected for both the full trajectory and resultant vector. The Monitor Marking panel (the next panel) to specify a colour legend or a default colour for the trajectory. The resultant vector displays in the default colour (that is, colour 1 of the current colour table). We recommended for visualisation purposes that you load the full trajectory as a dotted thin line, and the resultant vector as a continuous thicker line.
Note: The Line Style section only defines the type of line that you want to display - the resultant vector or the trajectory. If you want to colour the resultant vector, then you will need to create a colour scheme and specify that you want to use it through the Graphics Attributes panel.
All entries in the Monitor Scale and Movement panel are stored in the
<proj>.mon_spec
file as:
BEGIN$TAB DISPLAY ' ' ' ' ' ' END$TAB DISPLAY
Select Next.
The following panel is then displayed.
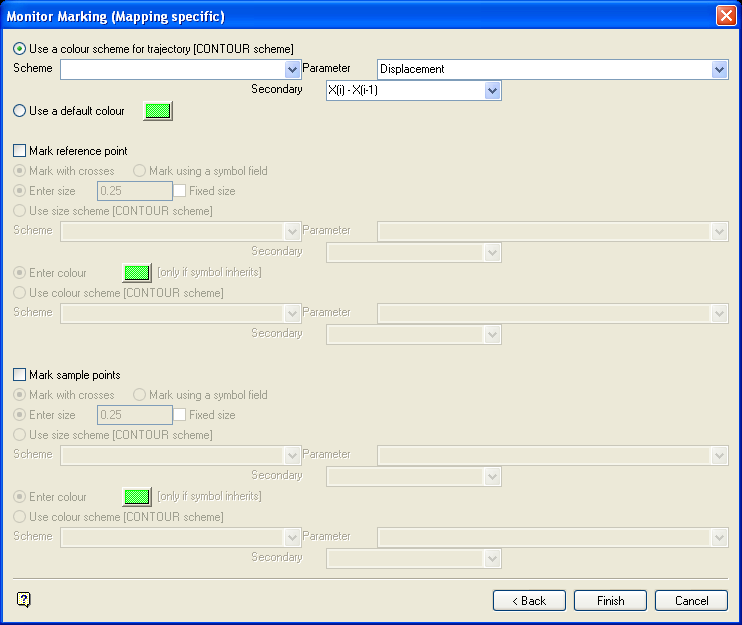
Monitor Marking panel
There are three available settings to select from these are:
Use a colour scheme for a trajectory
The trajectory of the monitor, can be marked using a single default colour selected from the current colour table or through the use of a colour legend from the Contour colour scheme. For example, a legend can be set up (under the Contour scheme) named displacement, to display the full trajectory using displacement and X(i) (actual value). This displays the full trajectory (and each individual sample) coloured according to the amount of displacement at each sample point. This is a very powerful way to visualise the data.
The Parameter field refers to both the Base and Extra parameters. The Secondary field relates to the seven derived values from the user-definable fields (see Extra Parameters in the Data Mapping option for details). There is no point in calculating or viewing the value for the second or even the first derivative of acceleration because acceleration itself is the first derivative of velocity.
Mark reference point
The monitor reference point can be marked using a cross or a symbol (from the symbol library). If you choose to use a symbol, the Enter size, Fixed size and Use size scheme options are activated.
The size of the reference point may be entered and/or displayed using a legend (from the Contour scheme) for any parameter chosen. The Fixed size check box refers to how the symbols are displayed. Fixed size are view scale invariant symbols, that is they stay the same size regardless of any zooming. If you do not check the Fixed size option, then the symbol size will change with the view.
The colour of the reference point can be displayed using either a standard colour of your choice, or by indicating a legend (from the Contour scheme ) for any parameter chosen.
For example, the size of the reference point may be determined by the Cycle (number of survey) parameter (using a cycle legend) and the colour by the displacement parameter (using a displacement legend). This is a very powerful way to visualise the data. A quick look at the size of the point will immediately inform you of the sample cycle of the monitor. A quick look at its colour will inform you of the displacement of the monitor.
Mark sample points
The monitor sample points can be marked using a cross or symbol. As per Reference point.
All entries in the Monitor Marking panel are stored in the
<proj>.mon_spec
file as:
BEGIN$TAB <mappingname>_MARK ' ' ' ' ' ' END$TAB <mappingname>_MARK
Select OK.

