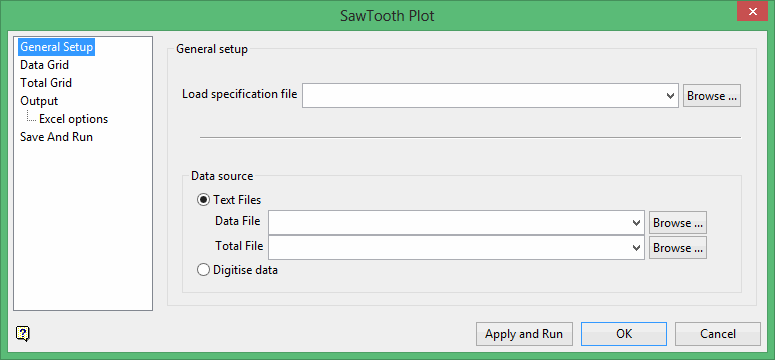
SawTooth Plot
Use the SawTooth Plot option to construct a saw tooth graph that displays the extraction of material. The resulting graph will be based on inventory by phase, bench and period tonnages of mineral and waste.
The information used to construct the resulting sawtooth graph can either be read from existing text files or manually entered. Both files must be column formatted ASCII files with the first line of each file containing a header.
Instructions
On the Open Pit menu, point to Open Cut Design, and then click SawTooth Plot to display the Saw Tooth Plot interface.

Related topics
- General Setup
- Data Grid
- Total Grid
- Output
- Excel options
- Save and Run

