Plot Utility Window
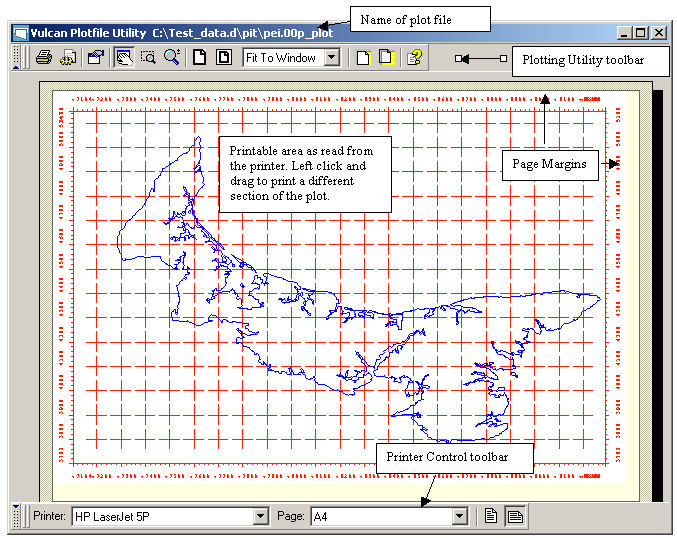
Figure 1 : Plot Utility Window
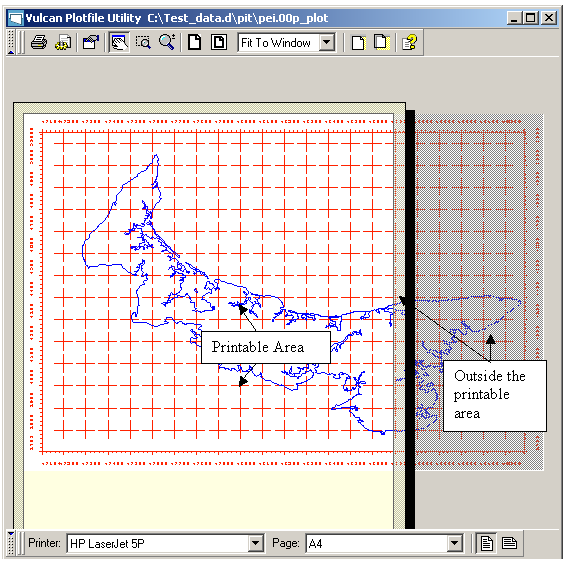
Figure 2 : Plot file that is too large for the selected page size
Each plot displays in its own Plot Utility window. You can use the Workbench > Window menu to alter the settings of these windows. For example, you could choose to maximise all of the windows and then use [CTRL] + [Tab] to toggle between the different plot previews.
The name of the plot file displays in the title bar.
The printable area (as read from the chosen printer) displays as a white rectangle with a yellow border (representing the margins) and a black shadow. Anything appearing outside of the white rectangle (that is in the margins or not on the page) will not be printed. If you use the mouse to hover over the printable area, the cursor changes to a hand indicating that it can be moved. If you want to plot a section of the plot, then move this rectangle (by left-clicking and dragging) over the required section.
Note: If no printers are installed, then the printable area is not displayed.

