Preferences - Graphics
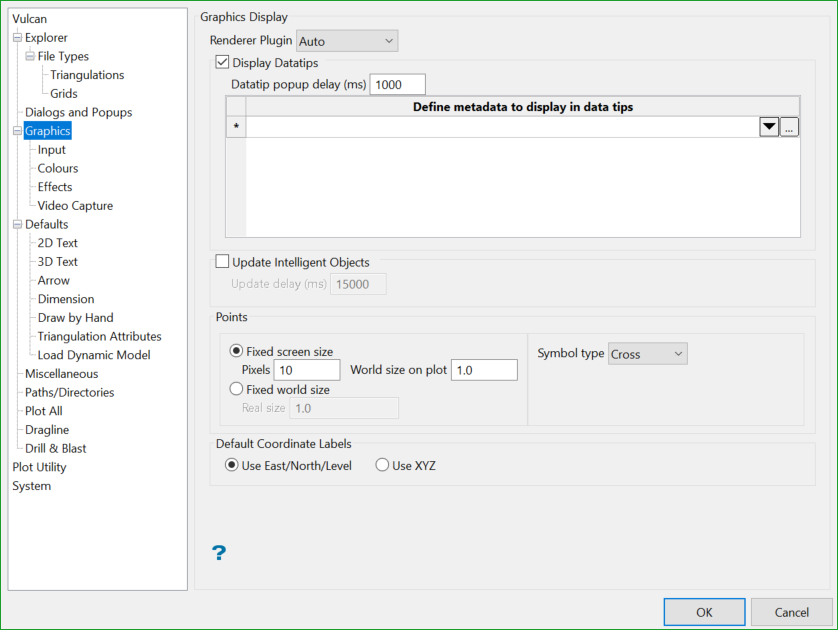
Renderer Plugin
This option allows to choose the renderer that is compatible with your graphics driver. There are mainly four plugins, namely Direct3D 11.1, Direct3D 12.0, Open GL 4.3, and Vulkan 1.0. However, there is an option Auto which automatically uses the required version among them. Auto is recommended to be used most of the time.
Display Datatips
Select this check box to display popup information for data loaded in a graphics window when the cursor is placed over it. If this check box is selected, you will need to specify the popup delay value (in milliseconds). This value refers to the amount of time the cursor needs to hover over the object before the datatip is displayed.
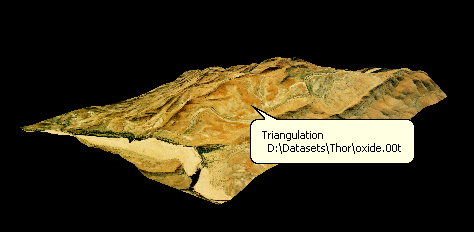
1 - Triangulation datatip
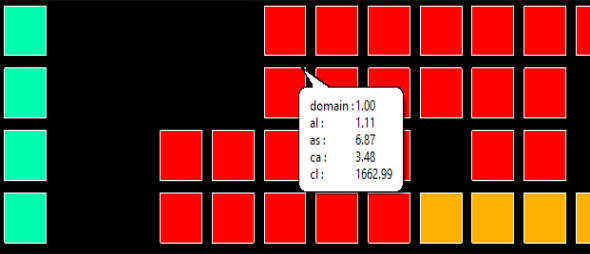
2 - Block model slice datatip (Section view)
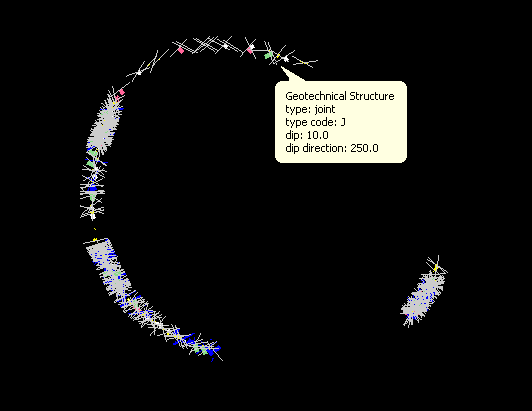
3 - Geotechnical Structure information
Define metadata to display in datatips
If your design data has associated metadata information, then you will have the ability to display this information through the datatips. You will need to select the appropriate metadata specification files (.mds) from the available grid control. Refer to the Design > Metadata submenu for more information on metadata functionality in Vulcan.
Update Intelligent Objects
Select this check box to dynamically update the attributes of your existing Intelligent Objects data. You will need to specify (in milliseconds) the time between updates. The maximum allowable value is '60 000' (60 seconds). This preference will be used by the dynamic locations and dynamic attributes tools of the Intelligent Objects Editor.
Points
Fixed screen size
Select this option to specify, in pixels, the size of the points. This means that the points stay the same size regardless of any manipulation of the design data. Therefore, zooming in and out does not affect the size of the points. Additionally, you may specify the desired world size on the plot.
Fixed world size
Select this option to specify, in real world units, the size of the points. This means the points are displayed the same size as they would appear in the real world. For example, if you used a point size of one unit (these are the units defined in your project file), then the point would be the same size as an object one metre long.
Symbol type
Select the symbol that will be used when displaying point locations, For example: a circle, square or cross.
Default Coordinate Labels
If the coordinate system has not be set in the. dg1 (For example: to AMG) and it is not a window with a special view type (For example: shaft view), then graphics annotations (that is, the axes) are labelled according to the preference specified in this section of the interface.
Note: Particular coordinate systems display particular axes labels. For example, Mercator coordinate system uses Lat, Long and level. Refer to the Project Specification file for more information.
Use East/North/Level
Select this option to label the axes East, North and Level.
Use XYZ
Select this option to label the axes X, Y and Z.
Note: If the background does not change when you select Draw Random Stars, Draw bearing/elevation grid or Draw backdrop, then you will need to activate the Window > Effects toolbar and then enable the Draw Background option. Alternatively, you can click Shift + G to activate the background.

