Preferences - Plot All
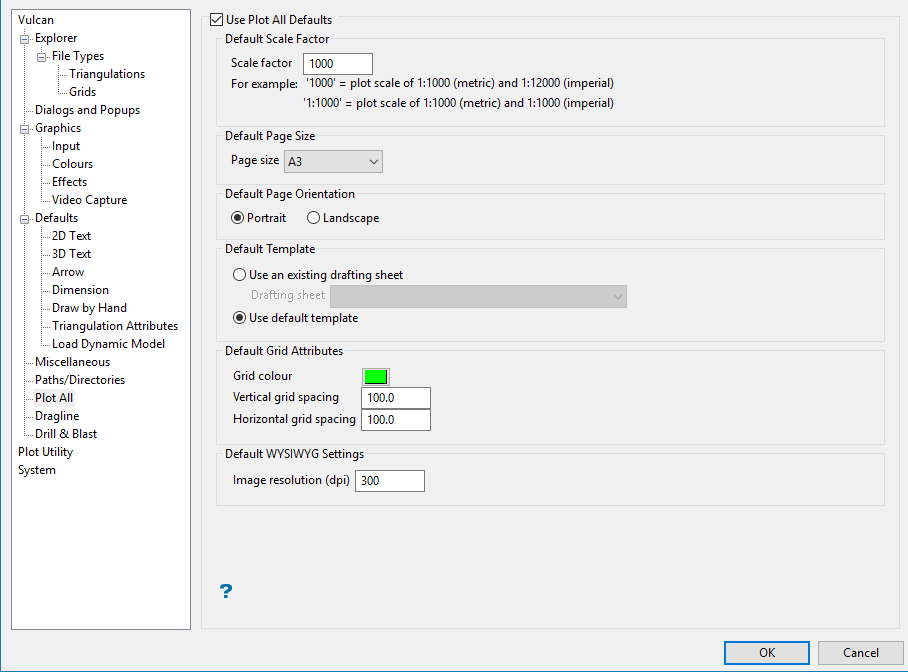
Use Plot All Defaults
Select this check box to use the defaults set through this interface when using the following options for the first time in a Vulcan session:
-
File > Plot > Plot All
-
File > Plot > Quick Plot
-
File > Plot > Cross Section
-
Geology > Washability Data > Plot By Area
-
Geotech > Utilities > Plot
-
Open Pit > Explosive Analysis > Generate Plans
-
Underground > Ring Design > Section Plot
Default Scale Factor
Enter the scale for the plots. The scale can be entered as a ratio or as a single number.
Note: The ratio is assumed to be 1:<n> when using a single number, that is, entering a value of '9' is the same as entering a ratio of '1:9'.
Default Page Size
Select the paper size.
Default Page Orientation
Specify the page orientation, that is, landscape or portrait.
Default Template
Specify whether you want to use an existing drafting sheet or the default drafting sheet delivered with Vulcan.
Default Grid Attributes
Specify the vertical and horizontal grid spacing, as well as the colour for grids. The colour is selected from the current colour table. The unit of measure for the grid spacing fields is the unit set for the current window (through the View > Windows > Create option ).
The default printer/plotter is specified through the Plot Utility section.
Default WYSIWYG Settings
Image resolution (dpi)
Specify the resolution (in dots per inch) of the image that will be generated and placed in the plot file. Take into account your paper size selection when choosing an image resolution. A general rule of thumb is to try to have the image width, in pixels, the same number as the width, in millimetres, of the selected area.
If your selected area is 10cm (100mm) wide, then you want the number of pixels to be 100, so the resolution should be 25.
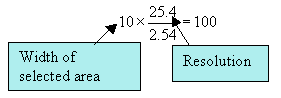
It is possible to have pixels spread over a greater width, that is one pixel for every 4 mm, however, you maybe disappointed with the final result. It is also possible to have more pixels per millimetre, i.e. 4 pixels for every 1 mm, however, this may use too much memory and the plot may not be printed. To achieve the best results with your printer, experiment with different resolution settings.

