Workflow diagrams
The most simple workflow diagram takes in data, interacts with it in some way, and then produces a user-specified output. For example, take the diagram below:
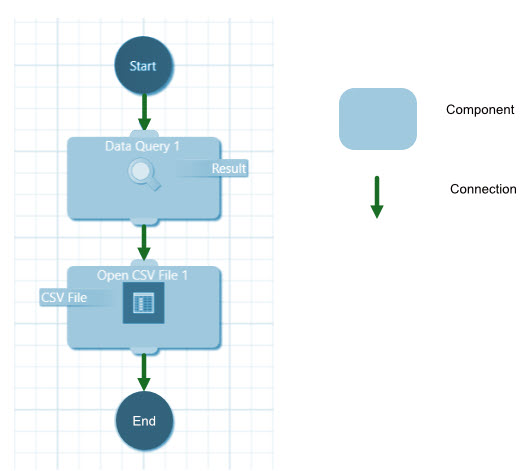
The circle labelled Start indicates where the procedure starts when the workflow is run. The circle labelled End indicates where the procedure ends.
Our workflow contains two operations, which are called components. Each component represents an action to perform on the incoming data. The first operation (Data Query 1) prompts the user to select a CSV file, while the second operation (Open CSV File 1) opens the CSV file. The two components are linked by an arrow indicating the flow of data through the diagram. This link is called a connection.
Next topic: Getting Started - Key Concepts - User interface