Schedule Report
Source file: strategy-schedules-standard-schedule-report.htm
You can view a schedule report by double-clicking a schedule in the project explorer. The report contains the tabs that can also be exported for further analysis.
Note: The categories shown in the Schedule Report will depend on the configuration of your setup.
Schedule overview
The Schedule Overview tab is composed of the following subtabs:
-
Calendar Report (that is opened directly when you select Schedule Overview in the schedule report)
-
Charts
Calendar Report
The Calendar Report subtab contains the following information groups:
-
Summary: Shows the time frames of each period of your schedule.
-
Overall Schedule Totals: Shows the mining and financial data per period.
-
Block Models (pit): Shows the mined tonnes and closure costs per period.
-
Process: Reports the cut-off grade applied to the following measures:
-
Process
-
Tonnes
-
Grades
-
Recovery
-
Costs
-
Revenue
-
Profit generated
-
-
Waste: Shows the mined waste tonnes and the associated costs per period.
-
Stockpile Accumulation: Reports the amount of material mined to the stockpile for a given period, along with the grades and mining costs.
-
Beneficiation Group: Shows the cut-off, the total feed grade and product grade, as well as total feed tonnes and product tonnes in each period of your schedule.
Charts
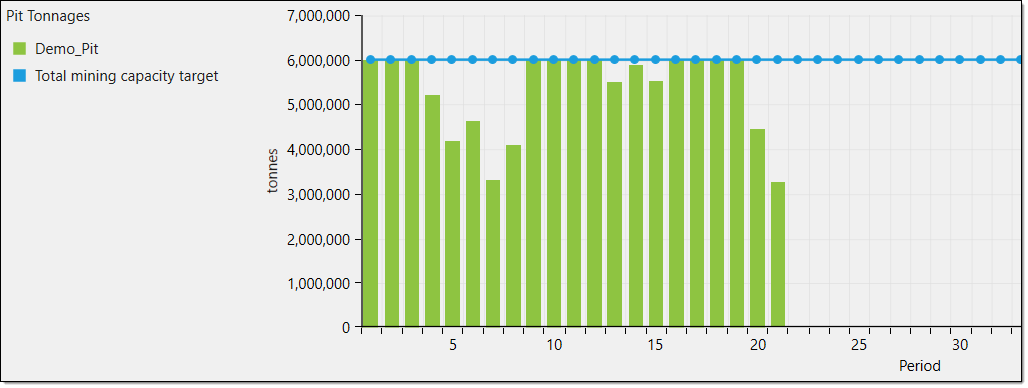
The Charts subtab displays charts based on variables in the Schedule Overview tab. If applicable, each chart will also feature a line depicting a chart target. This allows you to compare the schedule values against the targets set in the schedule setup. You can view the following charts in this subtab:
-
Pit Tonnages: Displays the total tonnages removed from the pit(s) per period.
-
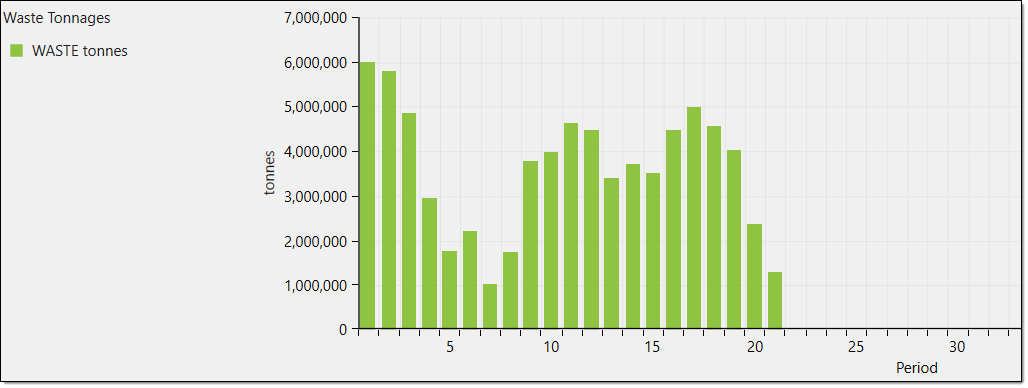
Waste Tonnages: Displays the total tonnages of waste mined per period.
-
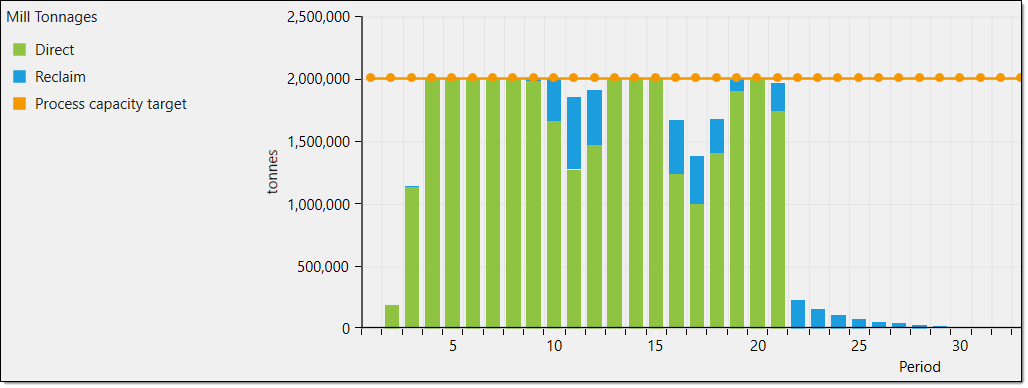
Mill Tonnages: Displays the tonnages processed by the mill directly and through stockpile reclaim.
-
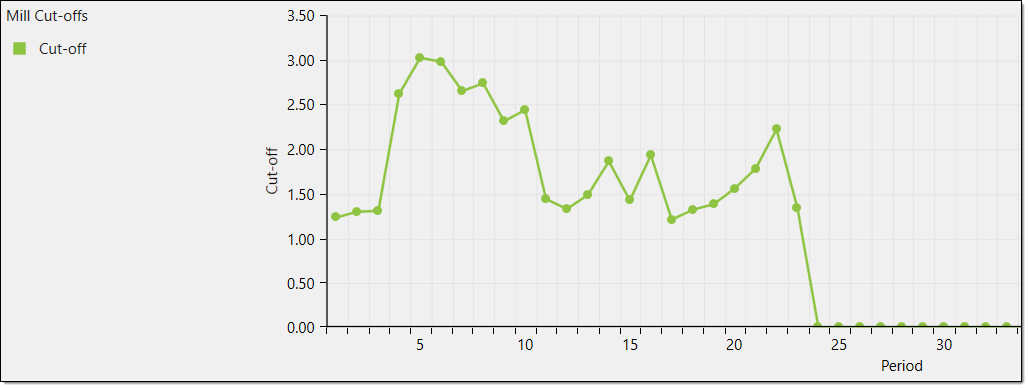
Mill Cut-off: Displays the cut-offs applied to the mill per period.
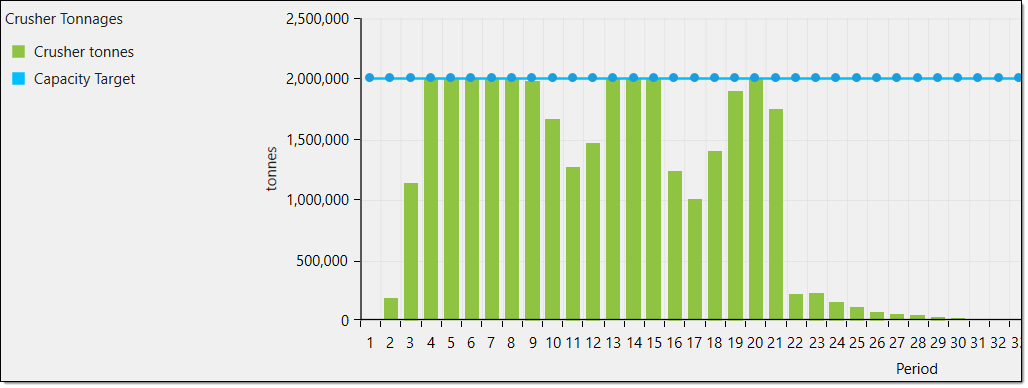
- Crusher Tonnages: Displays the tonnages of material generated by the crusher per period.
Other charts may also be displayed depending on your schedule setup. These include:
| Beneficiation Group Tonnages | Displays the tonnages processed within the beneficiation group per period. |
| Dependent Tonnages | Displays the total tonnages mined for each ore type when the processes are dependent on each other. |
| Dependent Cut-offs | Displays the cut-offs applied to the dependent processes. |
| Process Tonnages | Displays the tonnages generated by the process directly and through stockpile reclaim. |
| Process Cut-offs | Displays the cut-offs applied to the process. |
| Stockpile Inventory Mass | Displays the mass of each stockpile (including manual stockpiles) per period. |
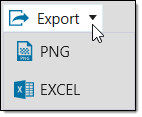
You can export these charts by clicking Export in the top left corner of the workspace. In the drop-down, select either a PNG or EXCEL export.
Beneficiation Groups
The Beneficiation Groups tab will be included in your schedule report when you have added one or more beneficiation groups to your setup.
The Beneficiation Groups tab will be composed of the following subtabs:
-
Calendar Report (entered directly when you select Beneficiation Group in the schedule report)
-
Charts
Calendar Report for beneficiation groups
The Calendar Report subtab for beneficiation groups in your setup will provide the breakdown of data for each process node within these groups, as well as the summary presenting the time frames of each period in your schedule.
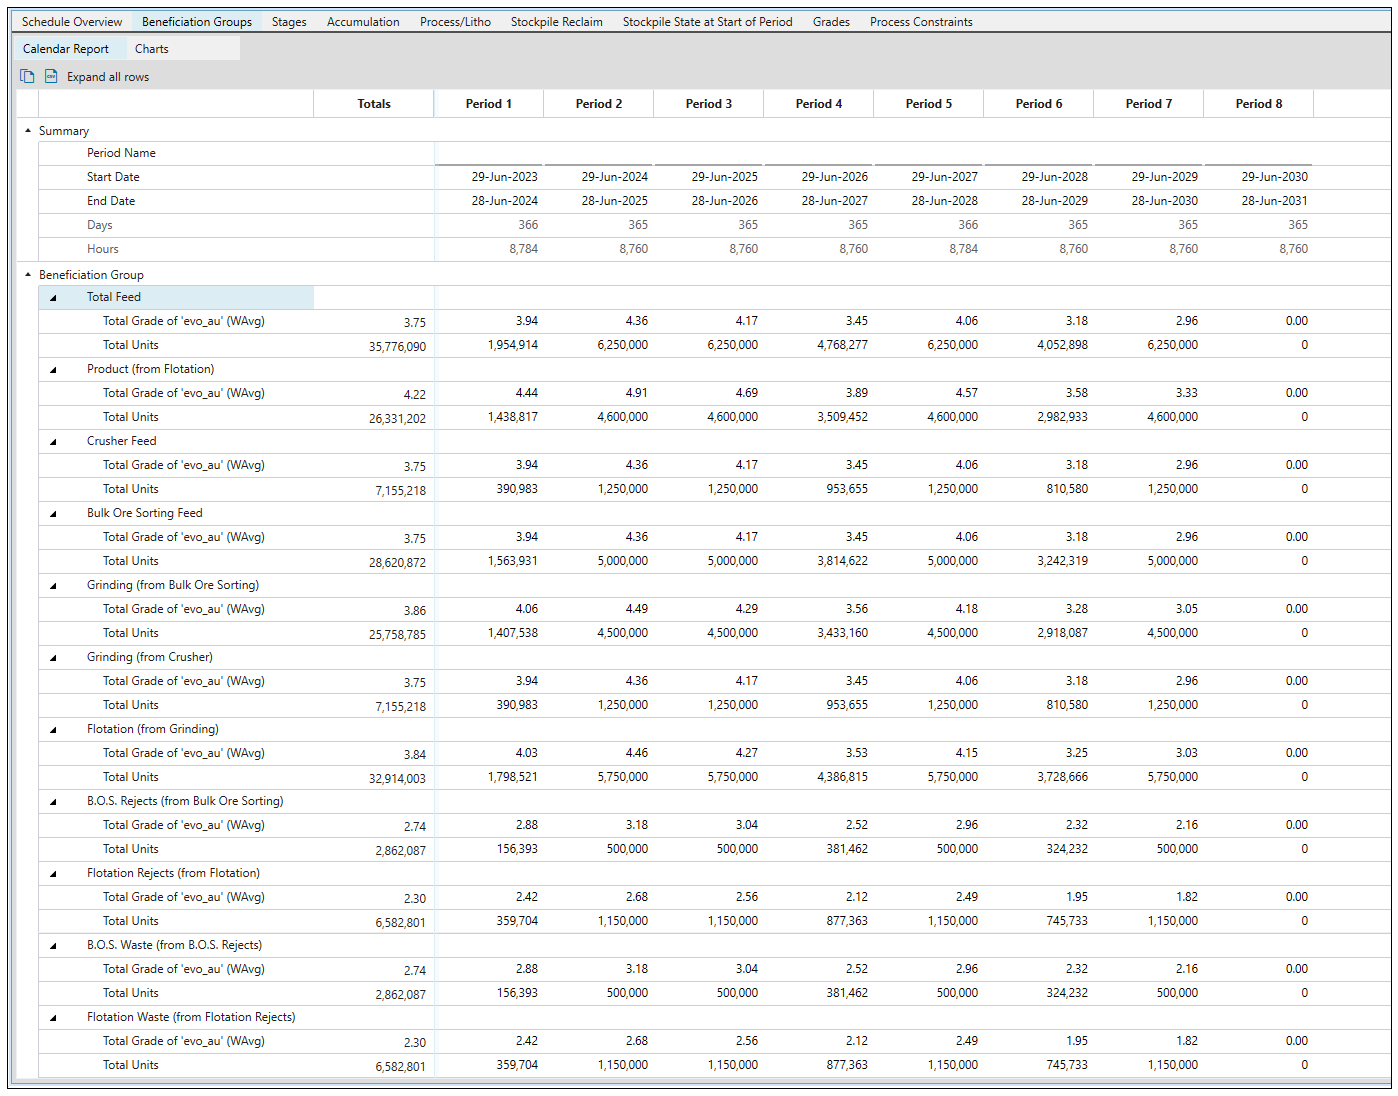
For more information on beneficiation groups, see Beneficiation Group.
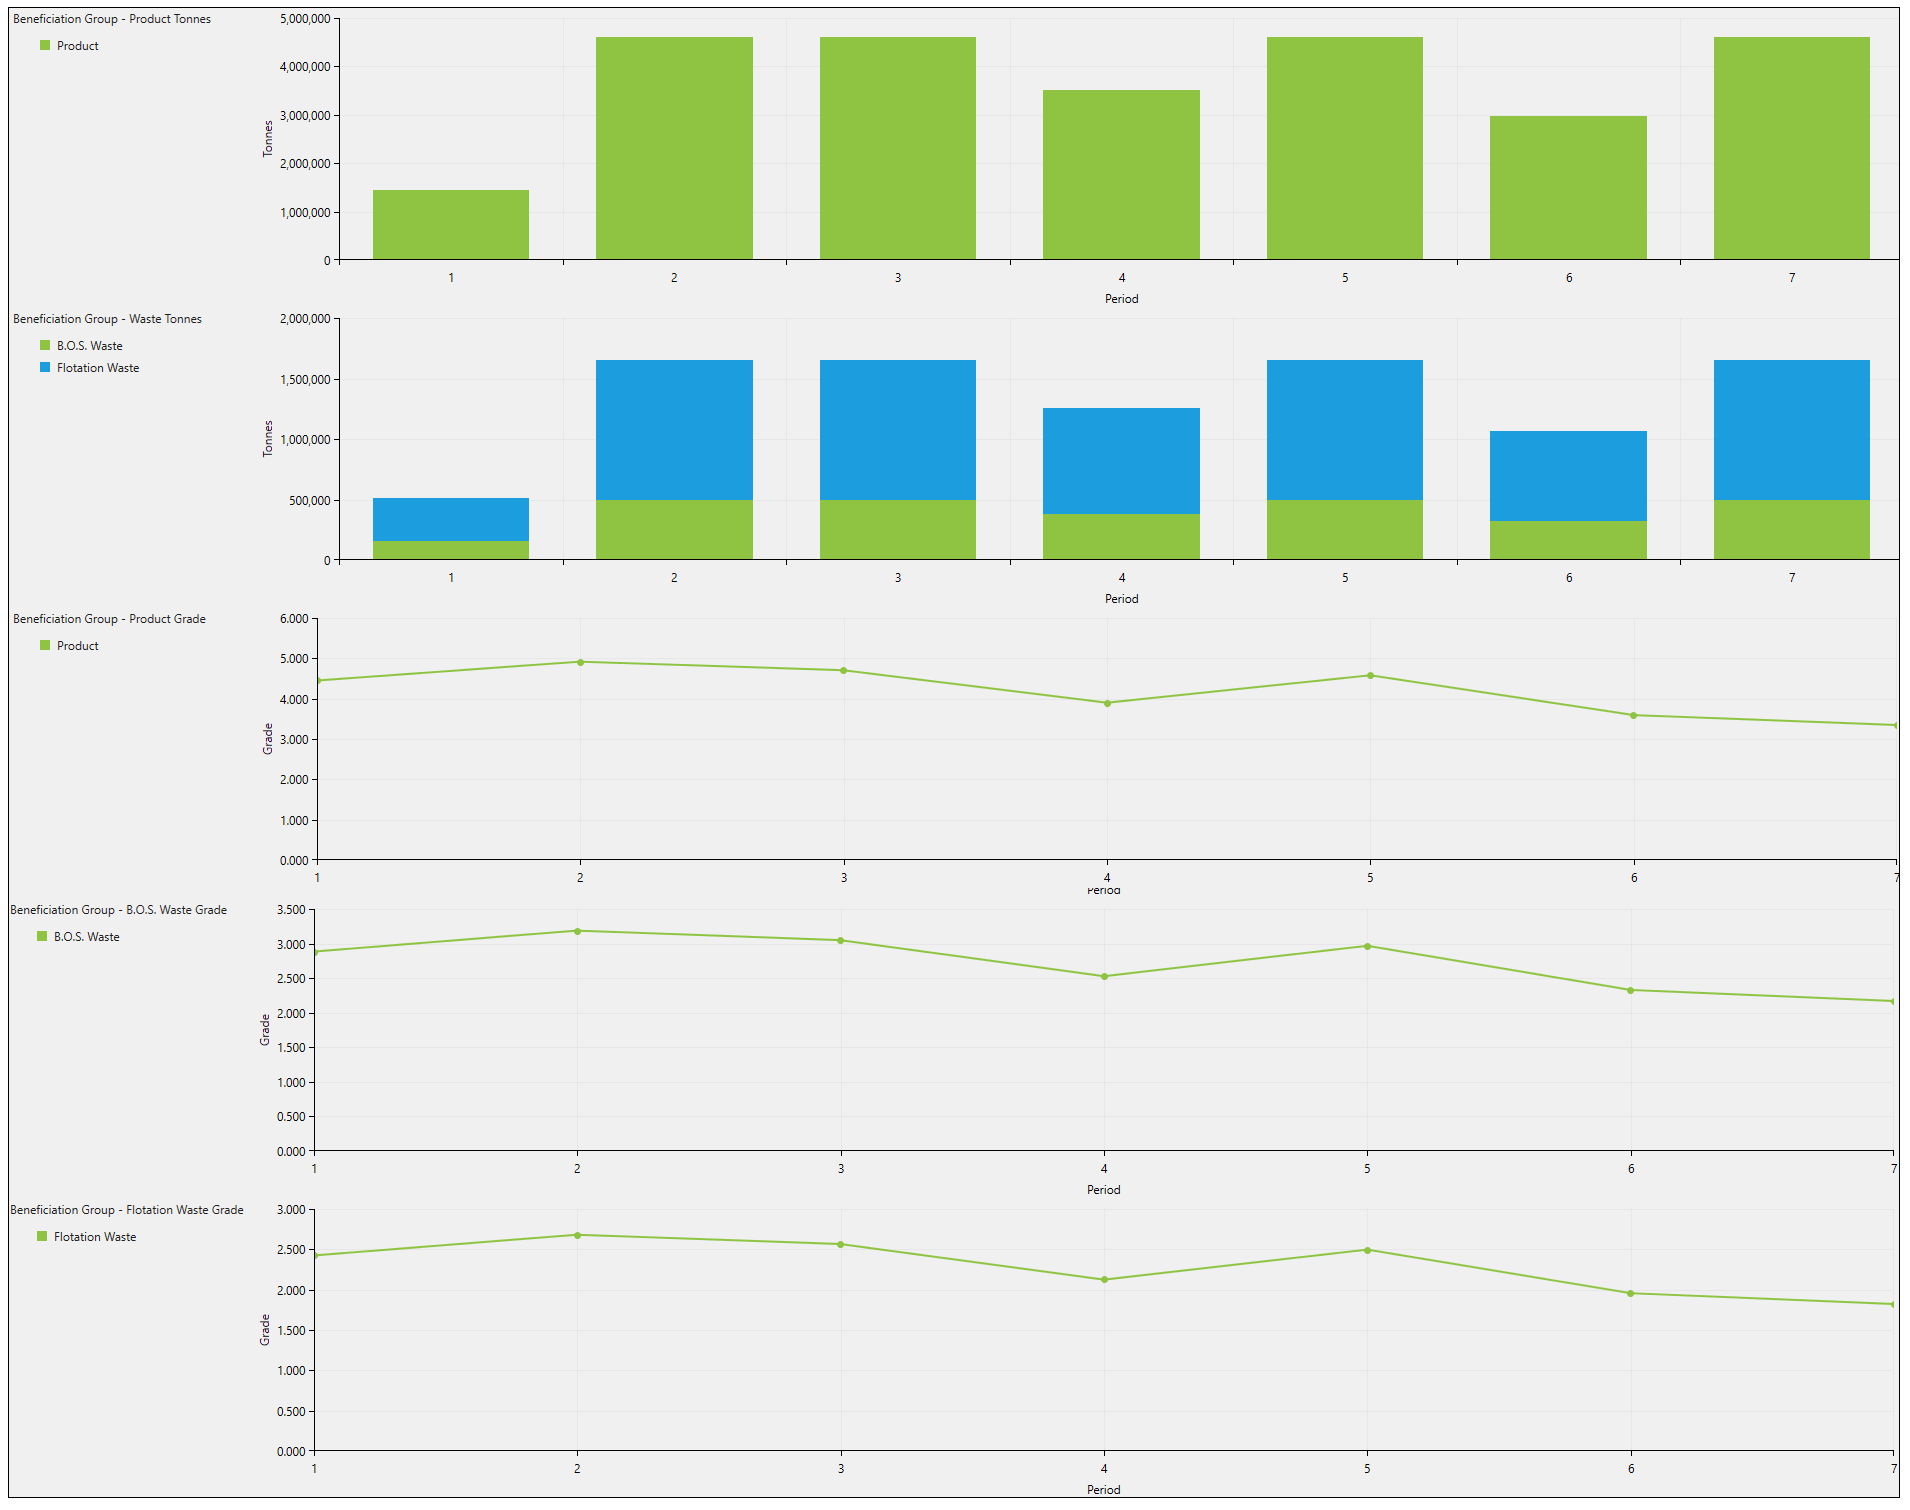
Charts for beneficiation groups
The Charts subtab displays charts for product tonnes and grade, as well as waste tonnes and grade. The data is shown on a period-by-period basis.
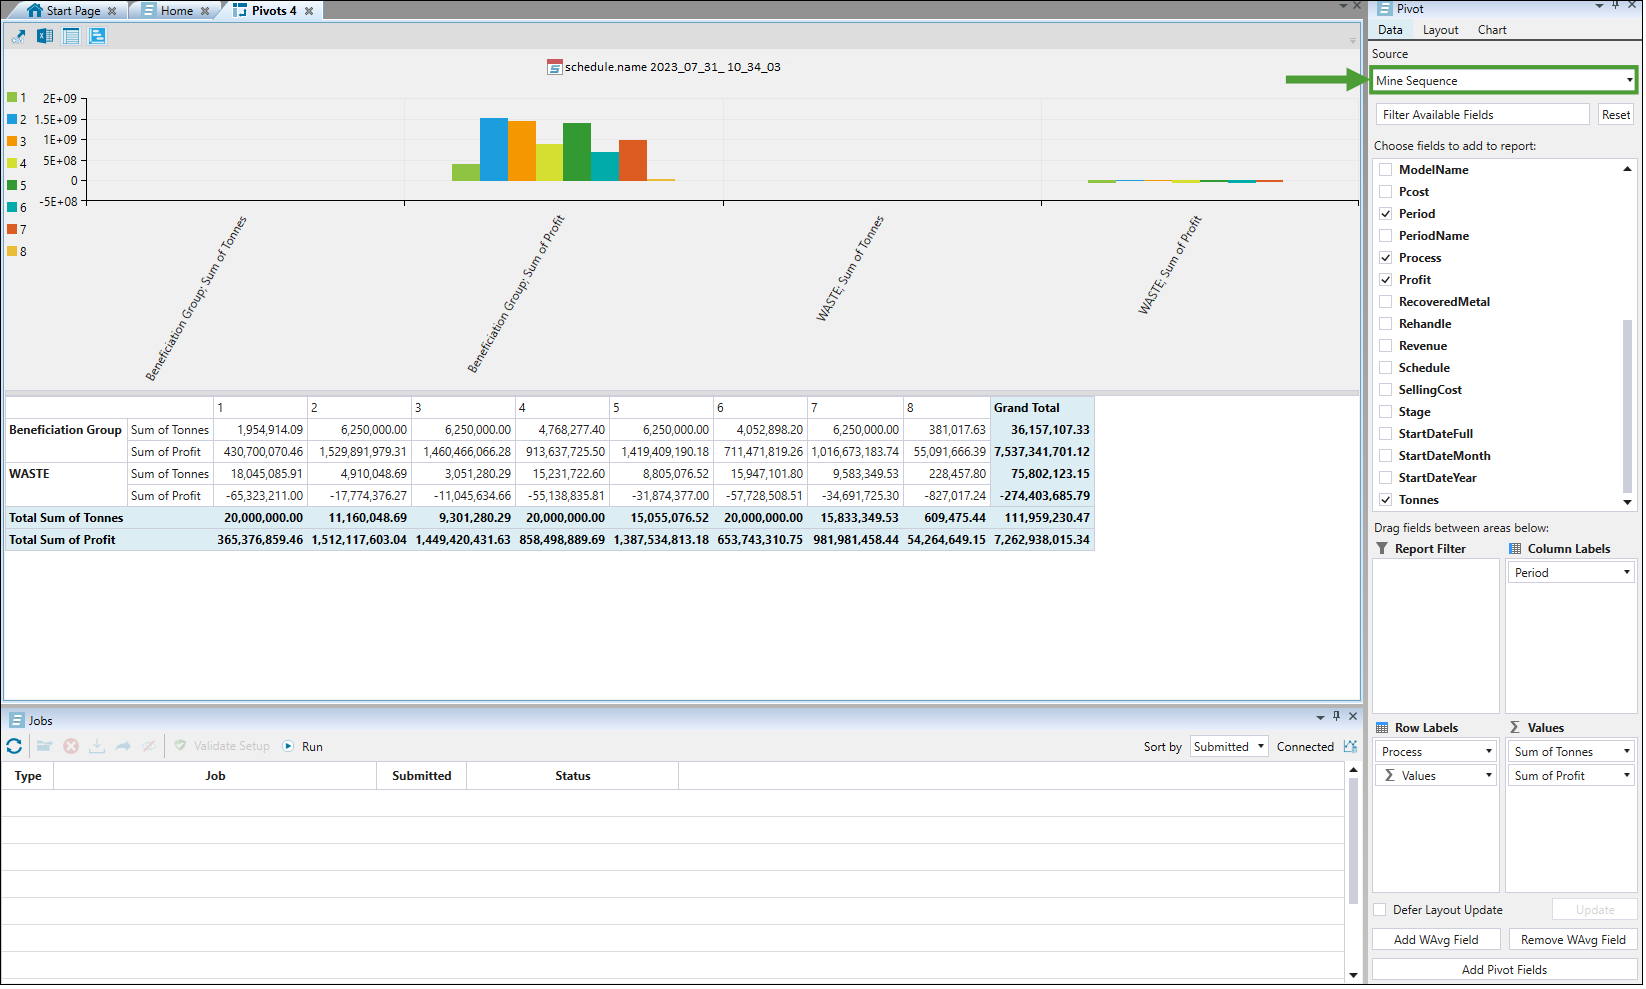
You can also create a pivot report for your beneficiation group setup.
When you select Mine Sequence from the Source drop-down in the Pivot window, you will be able to generate pivot reports comprising data from all processes in your setup.
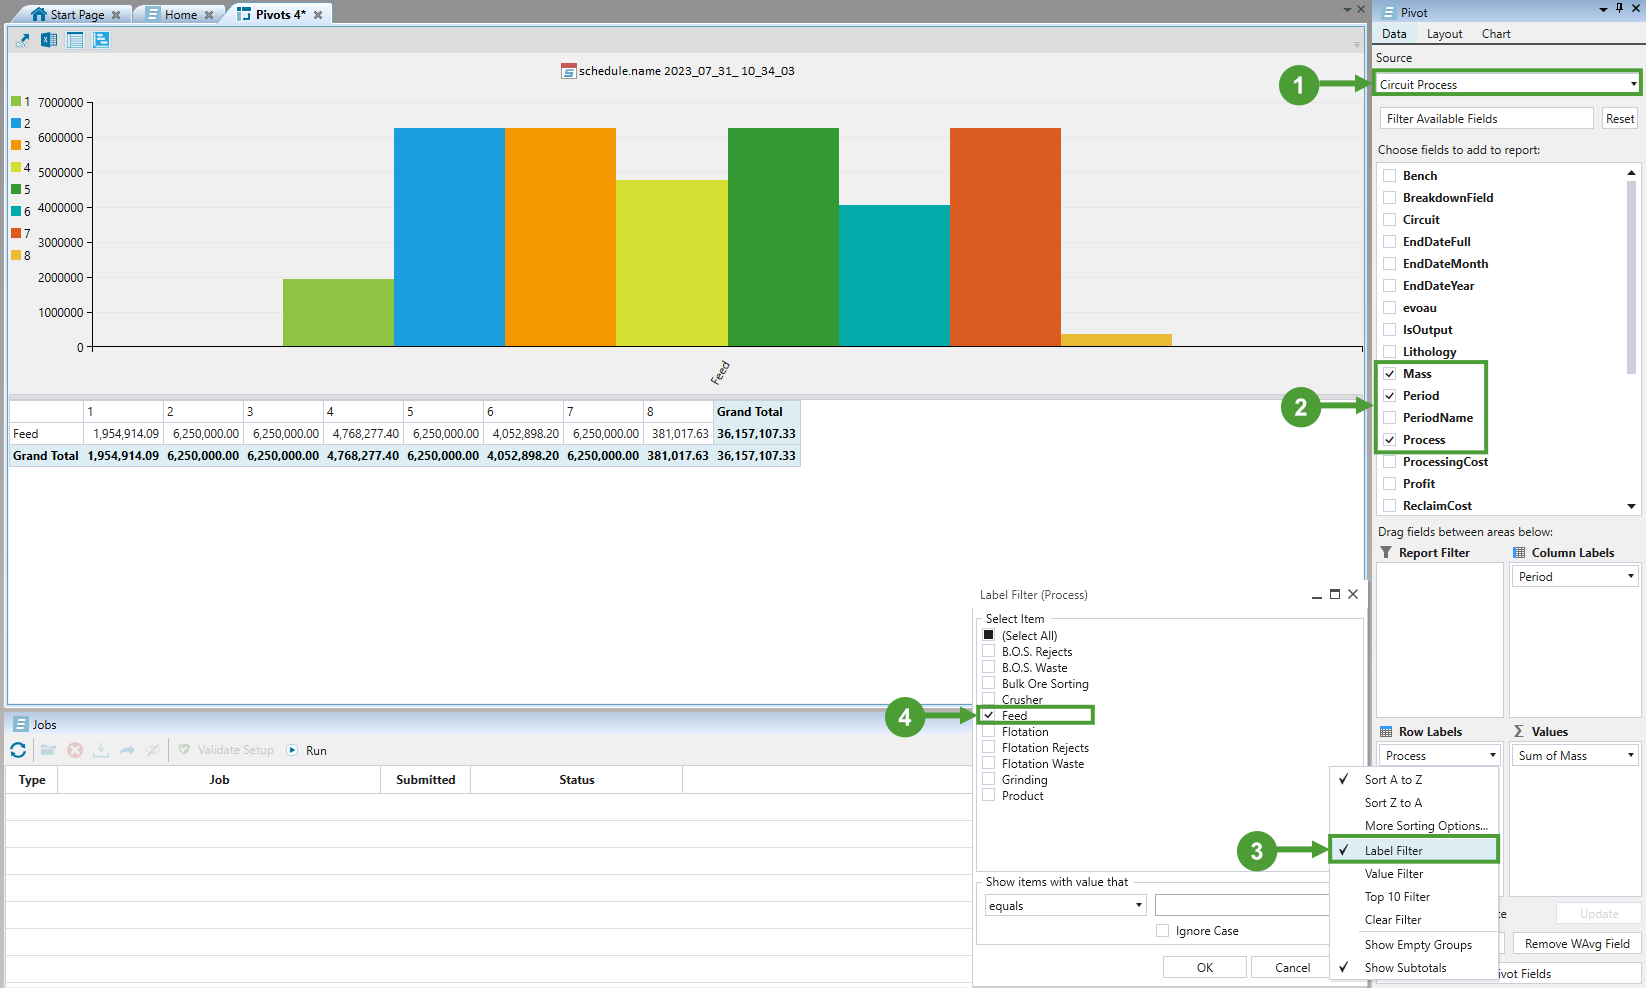
To display the values relating to the internal feed processes within a beneficiation group, follow these steps:
-
Filter the data by selecting Circuit Process in the Source drop-down.
-
Select the attributes to be displayed on the graph. Make sure you include the attribute representing the tonnage (it can be named Tonnes, Mass, or Parcel tonnes), period, and process.
-
After assigning the attribute representing the process to the Row Labels field, select Label Filter from the drop-down.
-
Select Feed from the Label Filter window.
For more information on pivot reports, see Pivot Reporting.
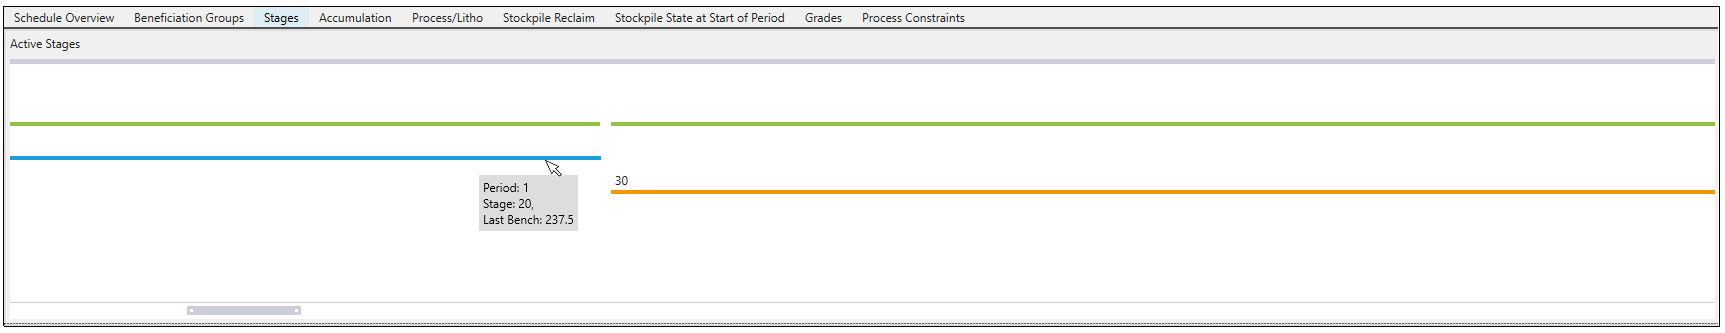
Stages
The Stages section details the following information:
-
Active Stages: Shows the active mining stages in a Gantt chart view on a period basis. Each stage is represented by a different colour. Hover over each graph line for more information.
-
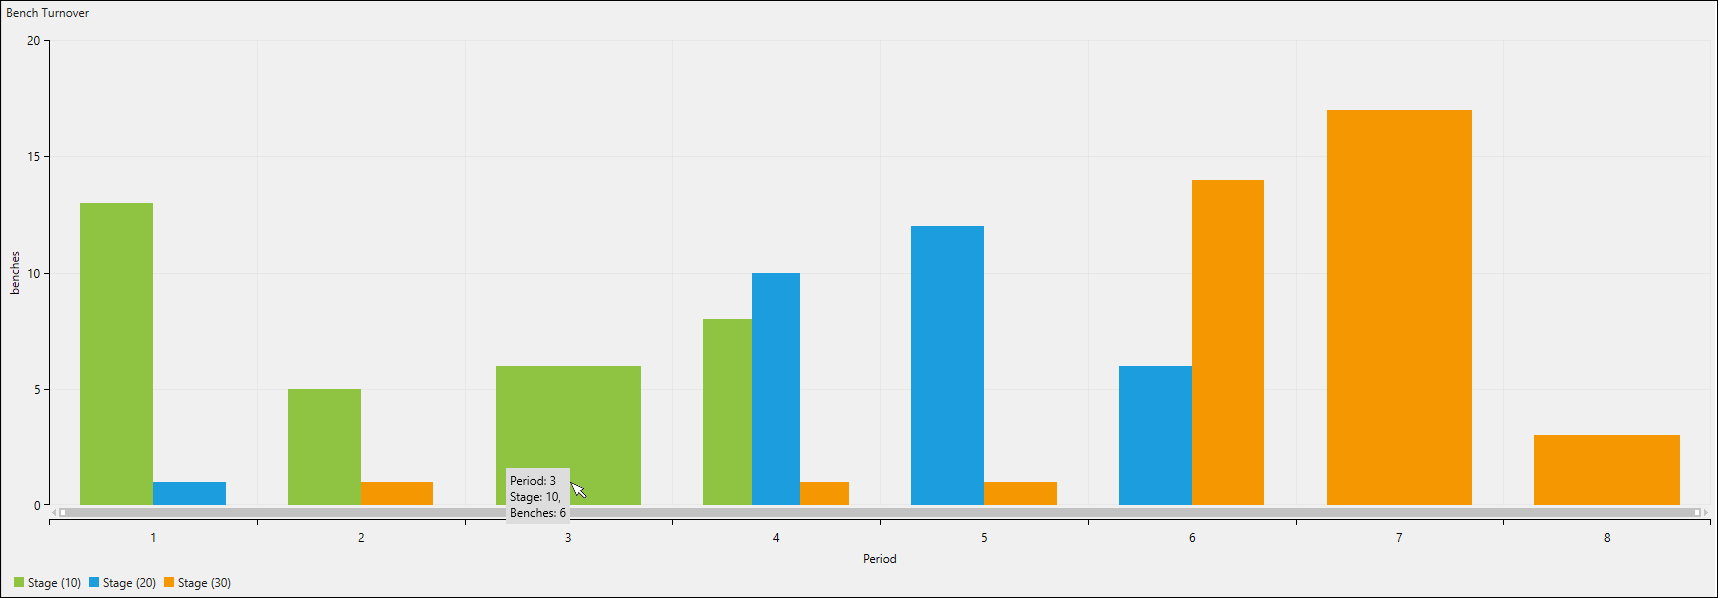
Bench Turnover: Shows the total number of benches (based on block height) mined in a period. Hover over each chart bar for more information.
Accumulation
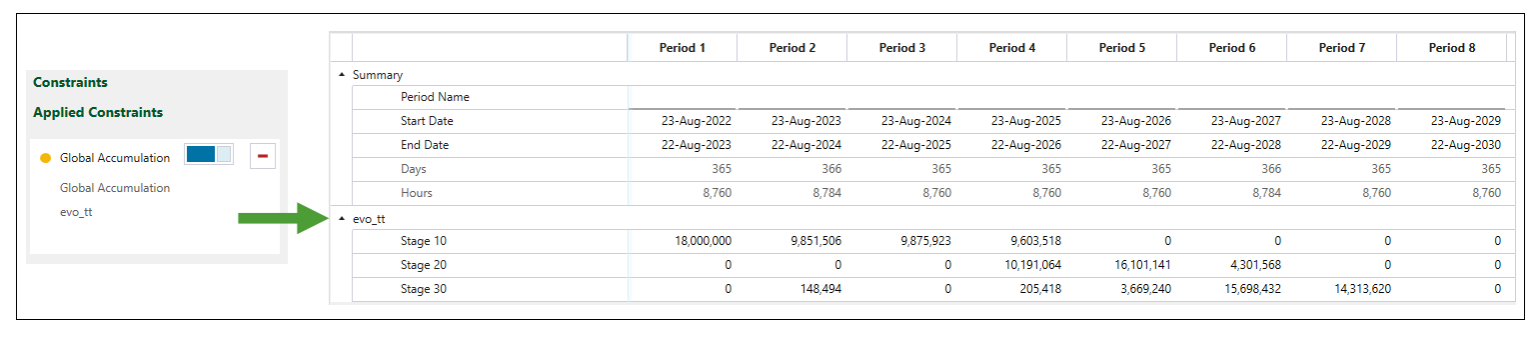
The Accumulation tab details the results of applying the accumulation-related constraints in your setup. For more information, see Constraints.
The example below shows the schedule report data for a setup where the Global Accumulation constraint has been applied.
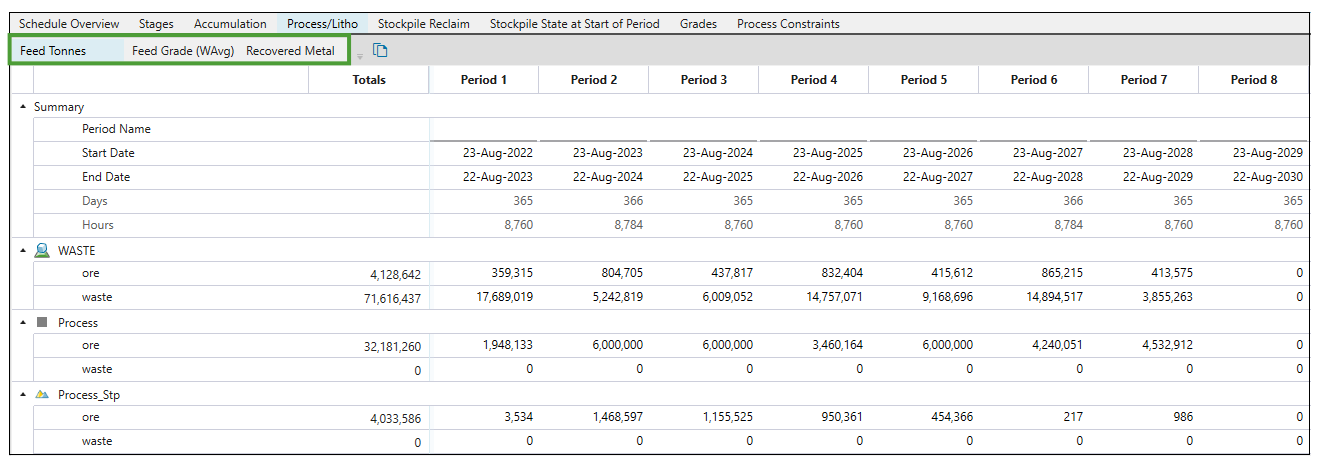
Process/Litho
The Process/Litho tab of the schedule report provides information on feed tonnes, feed grade (weighted average) and recovered metal for each process on a period-by-period basis. This data is provided in three separate subtabs, as shown in the image below.
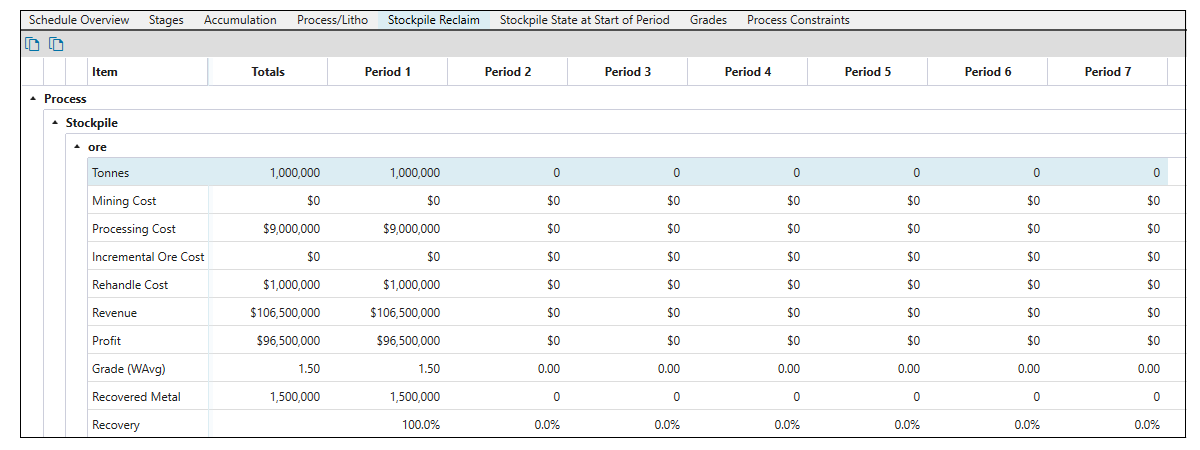
Stockpile Reclaim
The Stockpile Reclaim tab provides an economic breakdown of lithology for each stockpile in the setup.
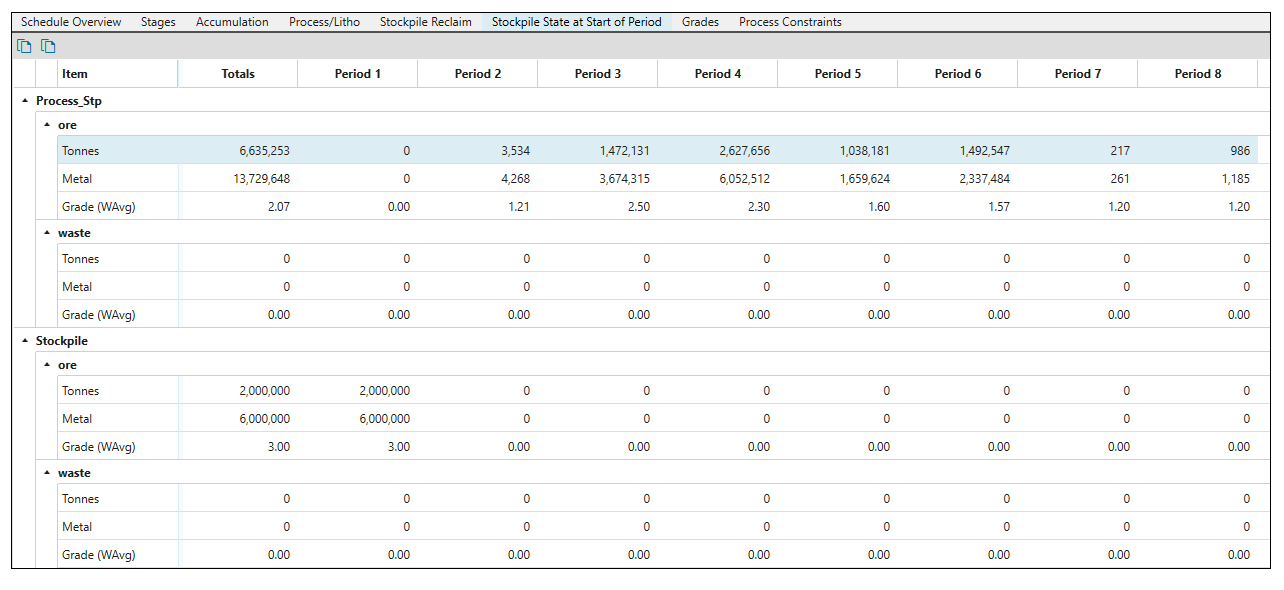
Stockpile State at Start of Period
The Stockpile State at Start of Period tab shows the amount of material that is available at the start of each period.
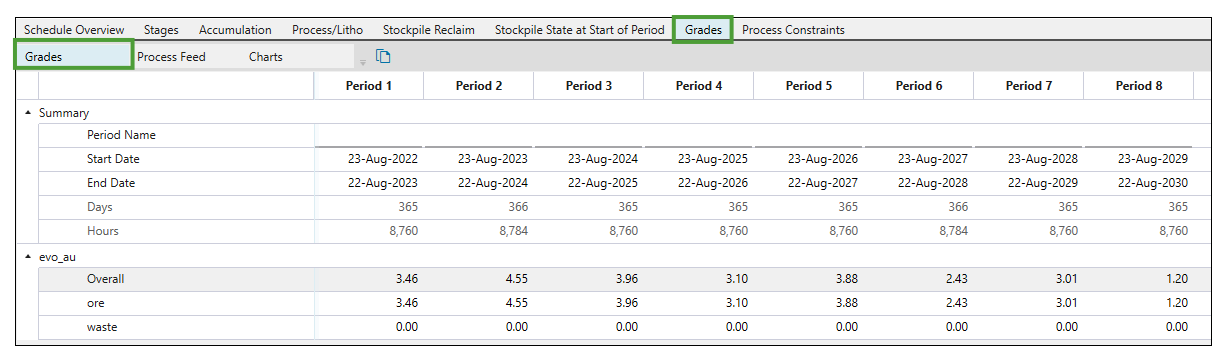
Grades
The Grades tab allows you to view the grade data on the following three subtabs:
-
Grades presents the grade per lithology.
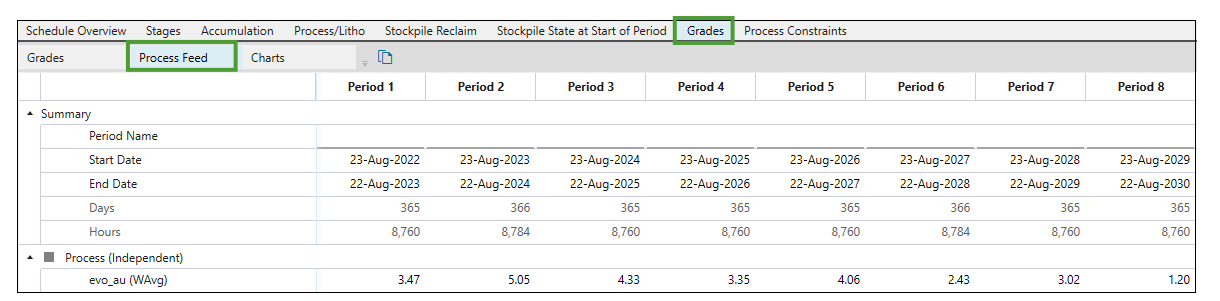
-
Process Feed shows the grade per process.
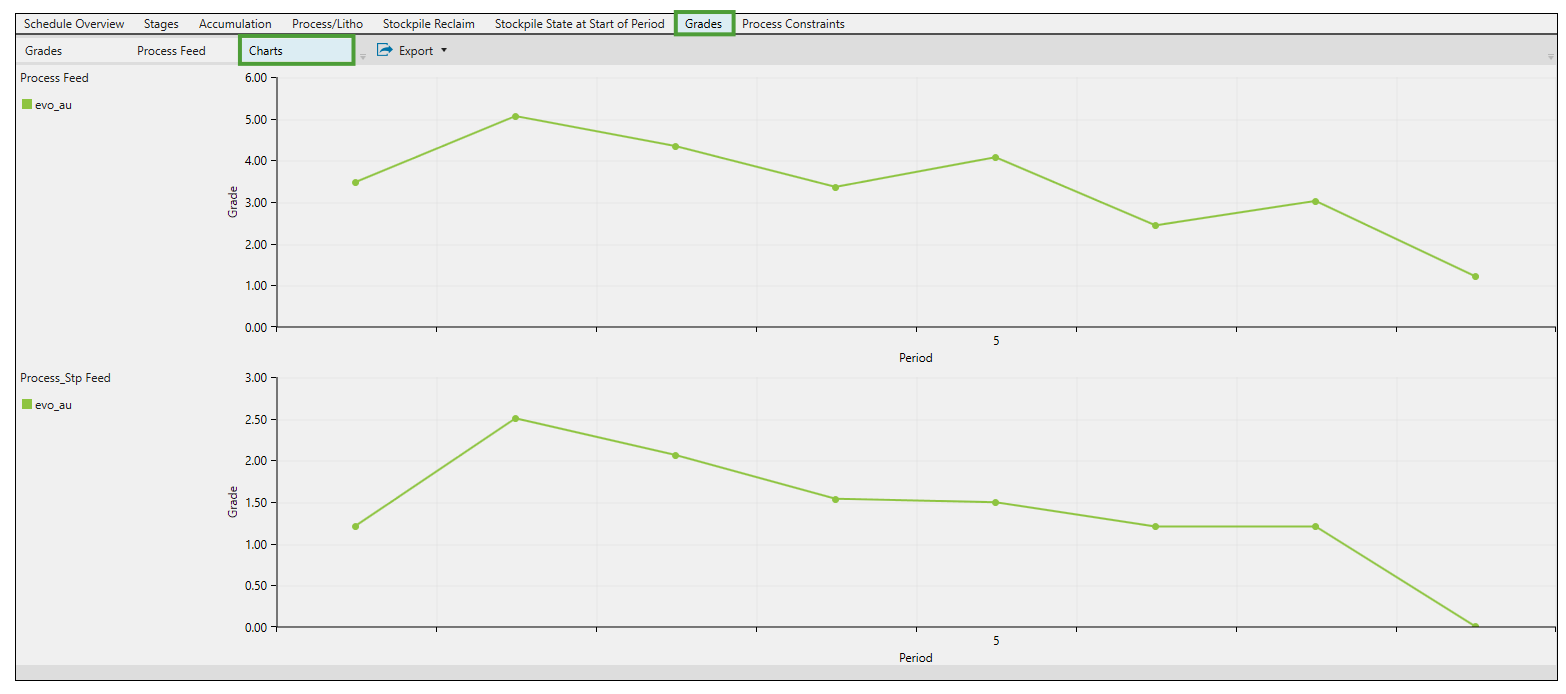
-
Charts pictures the grades per process in graph form.
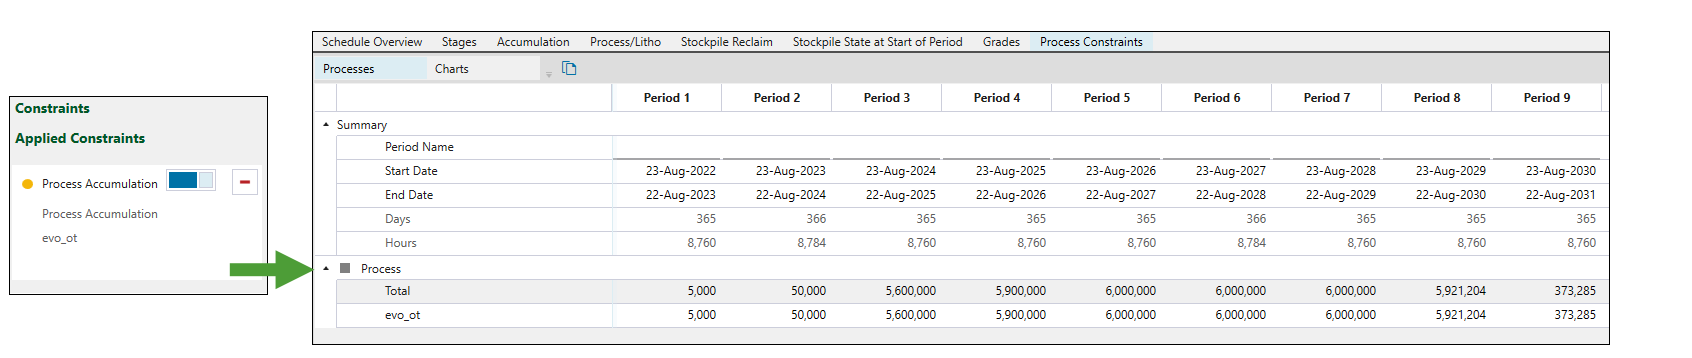
Process Constraints
The Process Constraints tab details the results of applying the process-related constraints in your setup. For more information, see Constraints.
The example below shows the schedule report data for a setup where the Process Accumulation constraint has been applied.