Checking design conformance
FieldHHC provides a set of design conformance tools as a licensed add-on. Design conformance allows you to compare registered as-built scan data against a design surface.
Important: Design conformance is a licensed feature. You need a licence tied to the scanner that acquired the scans to use it. See Licensing advanced tools for details.
The following features are included in the add-on:
Configuring design conformance settings
The design conformance tools require configuration before use. At a minimum, you need to supply a design surface to compare as-built scan data with. You also need a licence tied to the scanner that acquired the scans. You can also optionally supply a custom legend for colouring scans, and a report boundary to define the extent of conformance reports.
To configure design conformance, follow these steps:
-
Export the design surface and any additional objects such as custom legends or boundary polygons from PointStudio as Maptek object files (.maptekobj). Each object should be exported to a separate file.
-
Save the Maptek object files to a folder named Maptek Files on a USB key.
-
Insert the USB key into the FieldHHC tablet and transfer the files to FieldHHC. See Copying files from USB key for details.
-
In FieldHHC, go to
 Settings > Configuration > Licences and tap Configuration to open the Conformance and licence configuration panel.
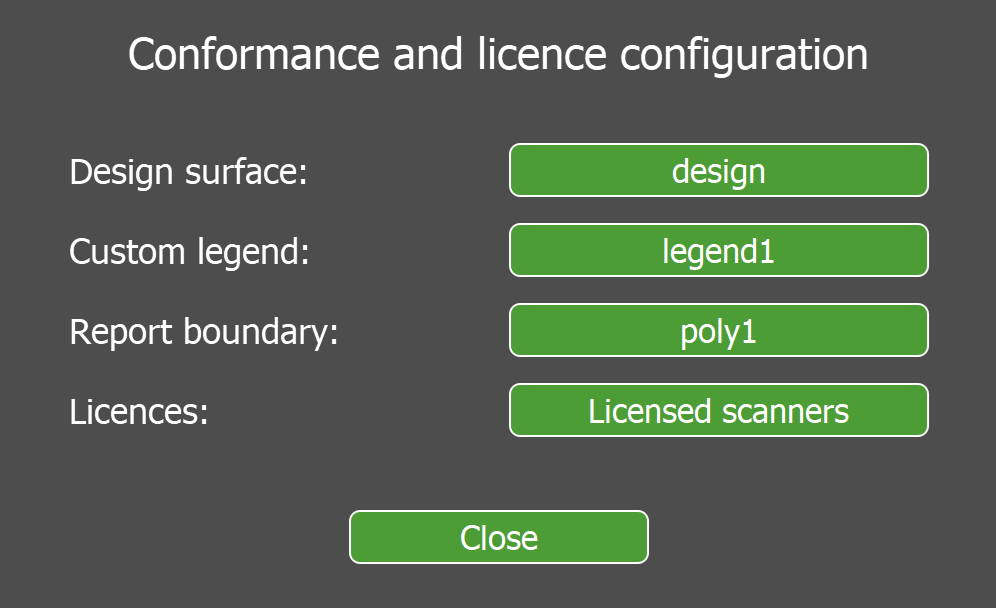
Figure 7-49 Configuration settings subtab
Configure the panel as follows:
-
Design surface: Set the surface to use for design conformance. The tool will list any surfaces that have been transferred to FieldHHC as Maptek object files (.maptekobj).
-
Custom legend: Set the legend to use to when colouring design conformance. The tool will list any legends that have been transferred to FieldHHC as Maptek object files (.maptekobj).
-
Report boundary: Set a polygon to use to limit the extent of the design conformance report. The tool will list any polygons that have been transferred to FieldHHC as Maptek object files (.maptekobj).
-
- Confirm that you have a valid licence installed by tapping Licensed scanners. See Licensing advanced tools for details on licensing advanced tools.
Starting design conformance view mode
Once conformance has been configured you can enter design conformance view mode on the  File Manager tab.
-
To start working with the design conformance tools, select one or more scans in the Scans list and then tap the
 (Design conformance) button.
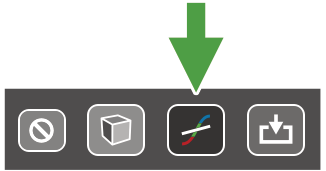
Tip: You can also include other objects such as polygons and surfaces in the design conformance view by selecting them in the files drawer along with the scans.
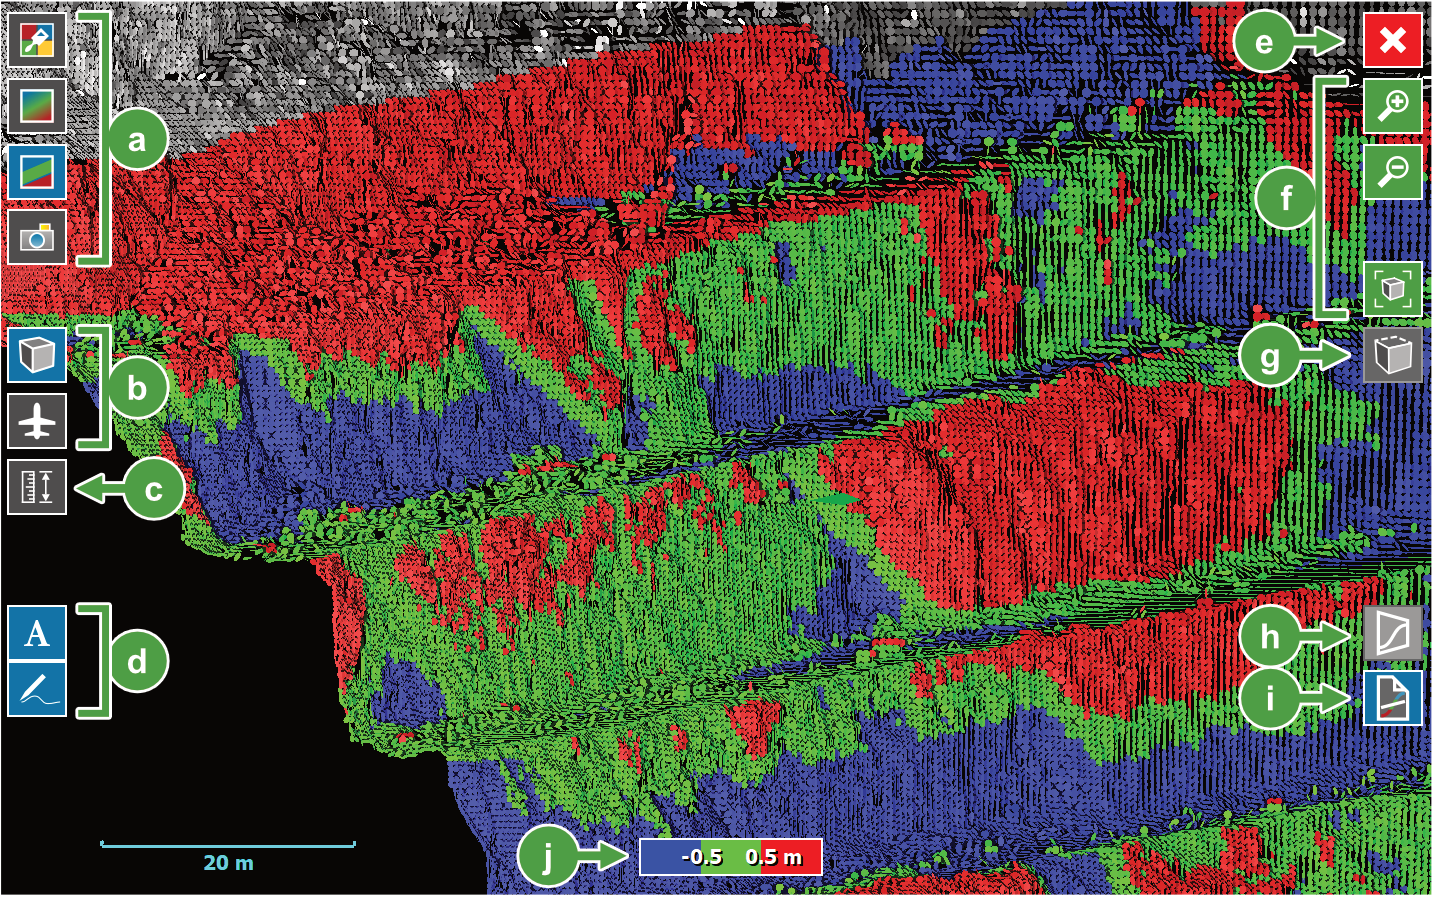
The scans will open in a 3D design conformance view, with scan points coloured by their distance to the design surface.
|
|
|
Figure 7-50 Design conformance view |
|
|
Colour schemes |
|
|
View modes |
|
|
Measure tool |
|
|
Annotation toggles |
|
|
Exit design conformance view |
|
|
Zoom controls |
|
|
Back face points toggle |
|
|
Cross section view |
|
|
Design conformance report tool |
|
|
Legend |


Colour schemes
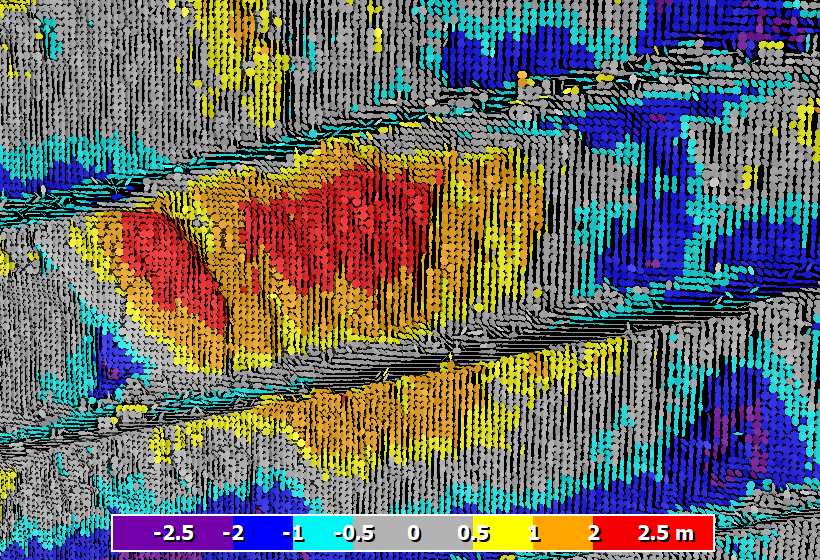
When you enter design conformance view, scan points are coloured by their distance to the design surface. You can choose from the following colour schemes:
|
|
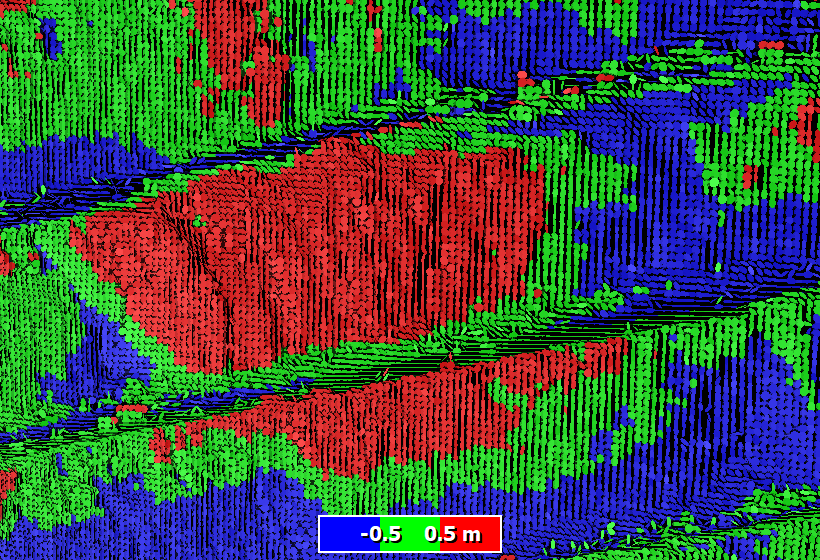
Solid colour Use a predefined solid colour legend. This is the default colour scheme. Scan points above or in front of the design surface at a distance of 0.5 m (1.6 ft) or more are coloured red. Points below or behind the design surface at a distance of 0.5 m or more a coloured blue. Points within 0.5 m are coloured green.
|
|
|
Smooth colour Use a predefined smooth colour legend. The legend colours distances using fixed intervals in the range ±0.5 m (±1.6 ft). Smooth colouring means colours between interval boundaries are interpolated, resulting in a gradient effect.
|
|
|
Custom legend Use a custom legend to colour scan points using colours and intervals of your choosing. You can define a custom legend in PointStudio and then transfer it to FieldHHC. See Configuring design conformance settings for more information.
Tip: When defining a custom legend’s boundaries, negative distances indicate points that are below or behind the design surface, and positive distances indicate points that are above or in front of the design surface. |
|
|
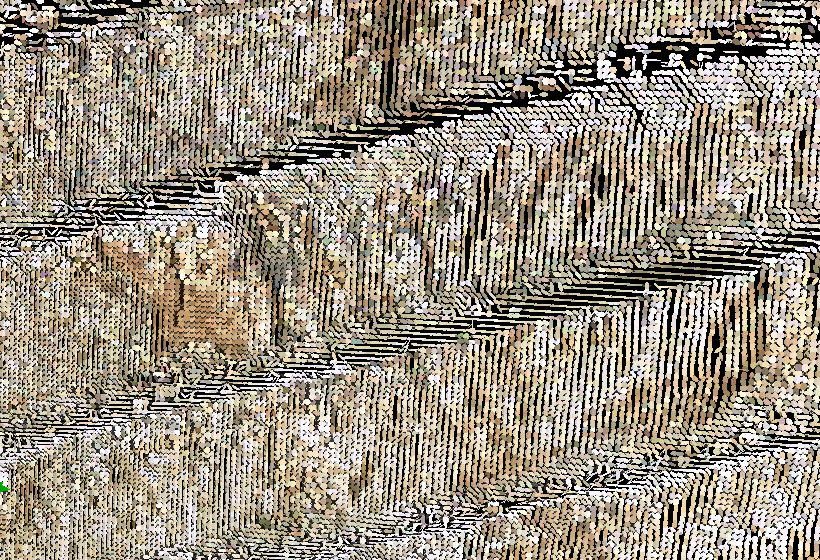
Photographic colour This scheme uses the scan’s photographic image to colour scan points. Distance to design colouring is not applied.
|


Measure tool
The measure tool allows to you query information at a point or between two points, and is also the starting point for creating cross sections.
-
To turn the measure tool on, tap the
 (Measure) button.
 -
To query the distance to design of a single point, tap the point.
The following values are displayed in the view:
-
to design: the shortest distance from the point to the design surface
-
xy: the XY component of the shortest distance vector from the point to the design surface
-
z: the Z component of the shortest distance vector
-
range: the distance from the scan origin to the point

Figure 7-51 Single point query using the measure tool.
-
-
To query the distance between two points, drag a line between the two points.
Information about each point is displayed as per the single point query, and the distance between the two points is shown on the line.

Figure 7-52 Two-point query using the measure tool.
Tip: To cancel the current query, tap on a blank part of the view. Tap  (Z-Up mode) to continue panning and rotating the view.
Creating cross sections
You can create a cross section at any point, or between two points, using the measure tool.
-
Using a single point will create a cross section from the vertical plane that is perpendicular to the design surface at that point. The horizontal axis of the cross section will include the maximum extent of the data.

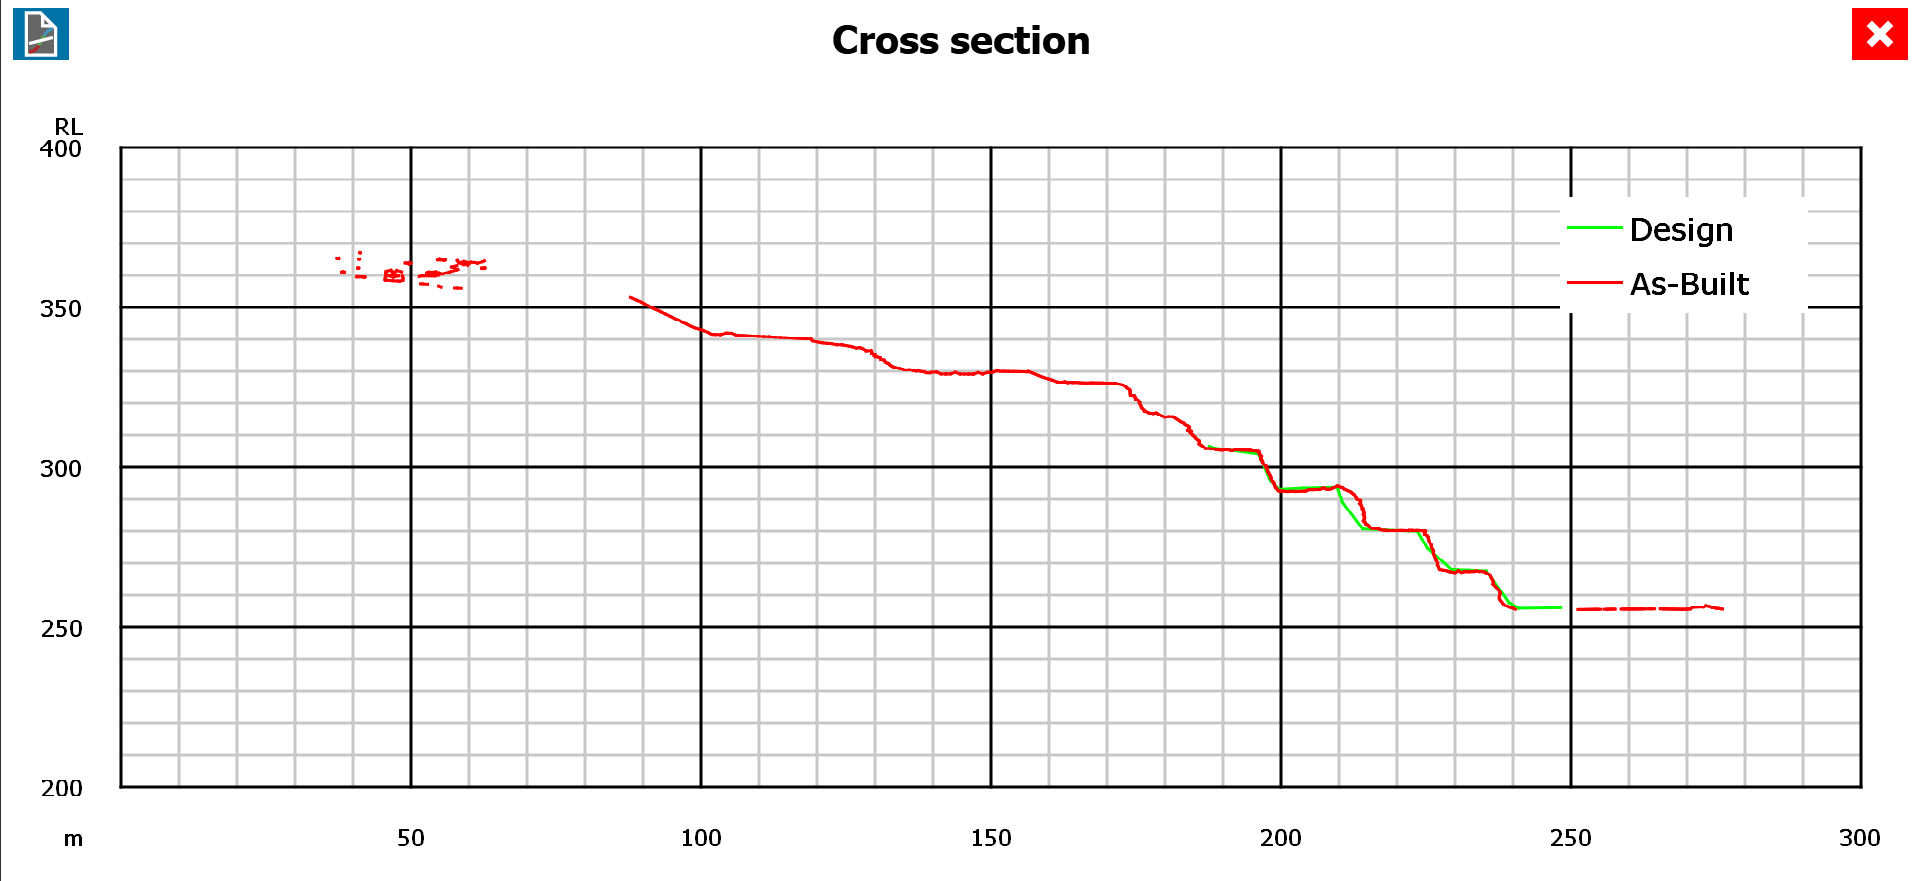
Figure 7-53 Single point query (left) and the resulting cross section (right)
-
Using two points will create a cross section from the vertical plane that passes through the two points. The horizontal axis of the cross section will cover the extent of data between the two points.
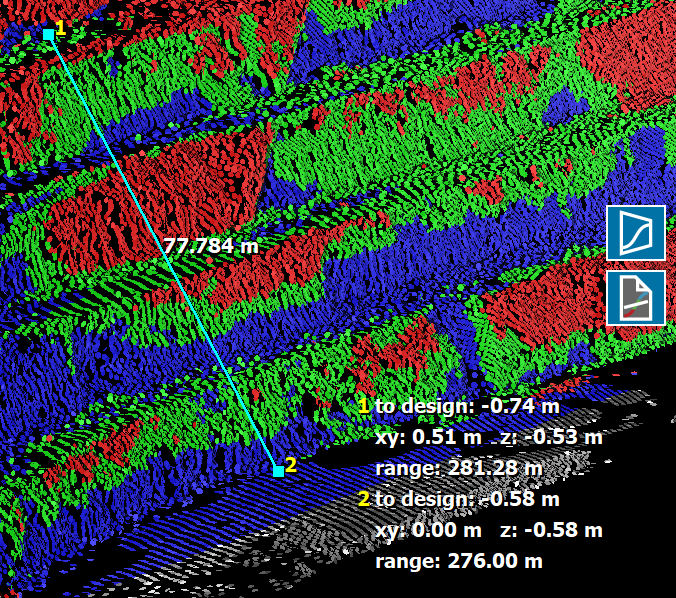
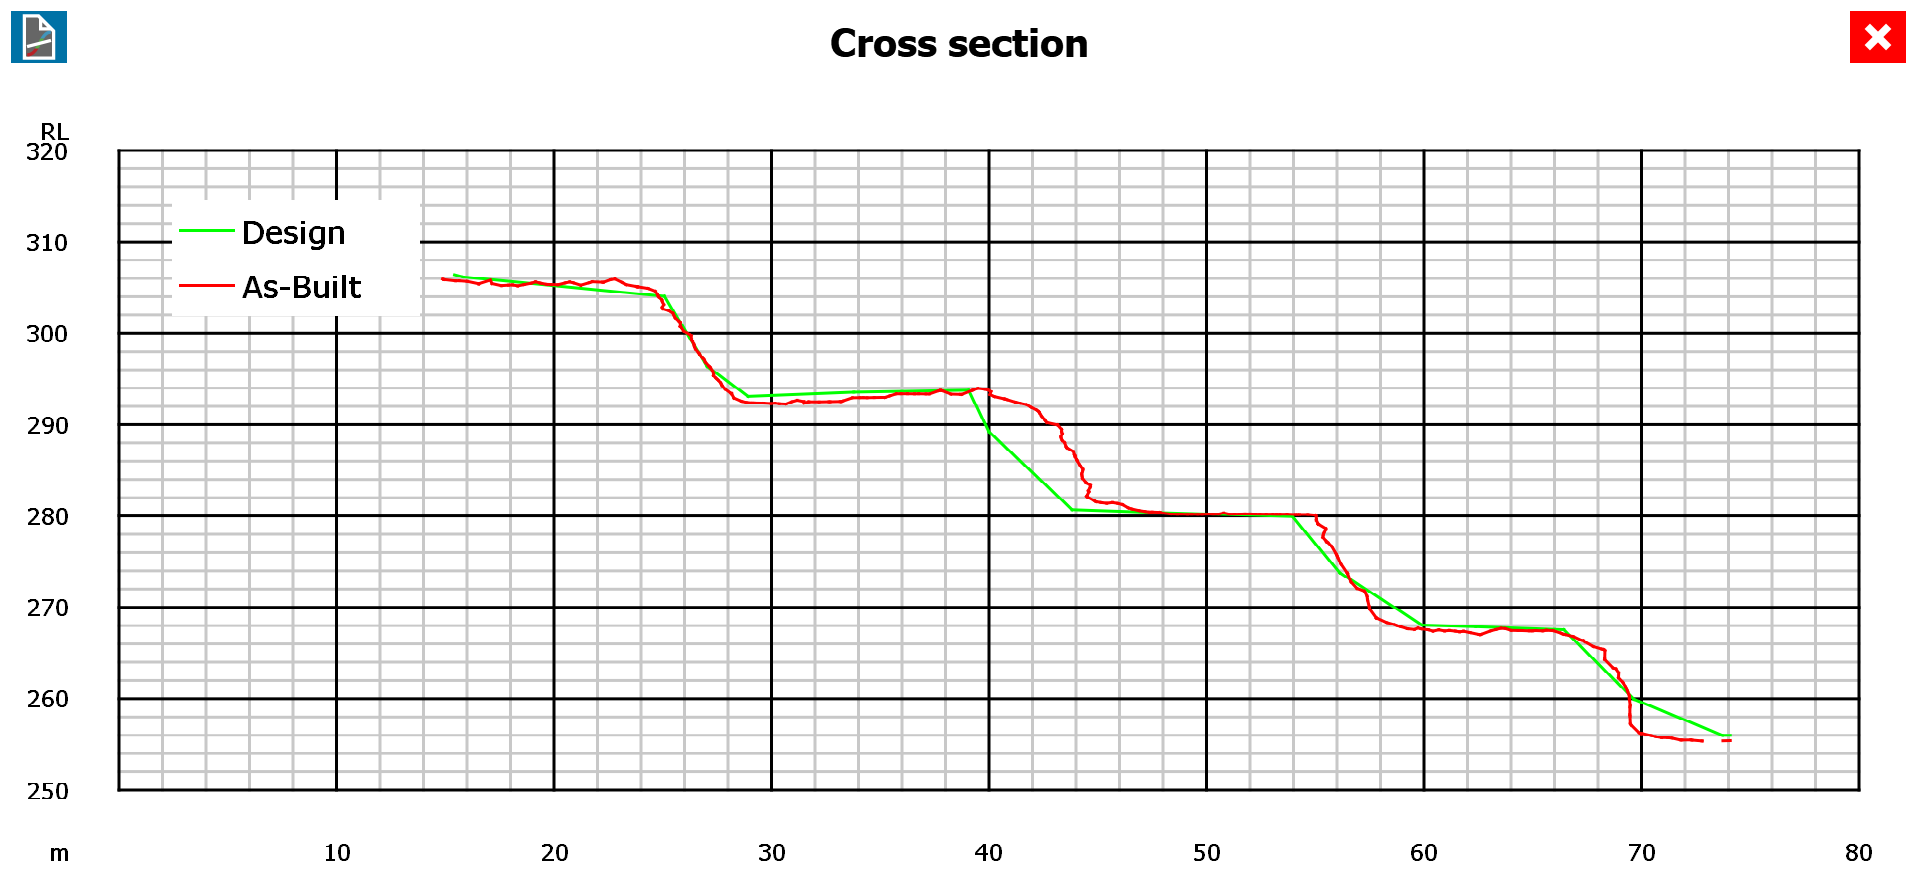
Figure 7-54 Two-point query (left) and the resulting cross section (right) showing only data between the two points.
To create a cross section:
-
Start by performing a single or two-point query using the measure tool (
) .-
Tap a single point to perform a single-point query.
-
Drag a line between two points to perform a two-point query.
-
-
Tap the
 (Cross section) button to generate the cross section.
-
To generate a PDF cross section report, make sure a USB key is inserted, then tap the
 (Generate report) button located in the top-left corner of the cross section panel. The report PDF is saved to the folder Maptek Files on the USB key.
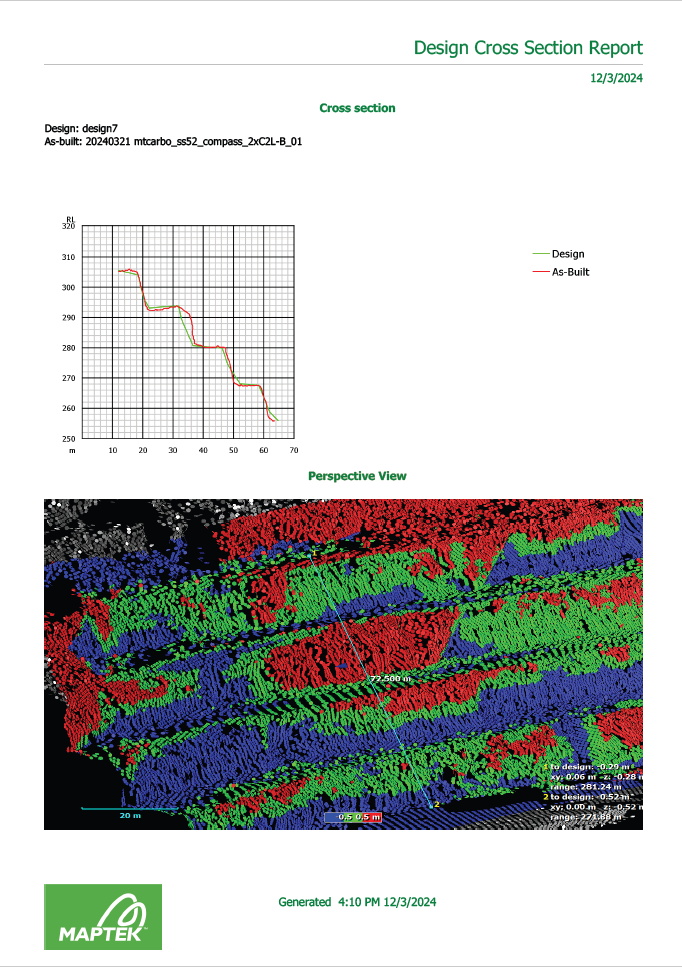
Figure 7-55 Example cross section report.
-
Tap the
 button to close the cross section panel and return to the 3D design conformance view.
-
Creating a design conformance report
You can create a design conformance report by tapping the  button in the design conformance view.
To create a design conformance report:
-
Configure the design conformance settings as explained in Configuring design conformance settings.
Note: If you want to restrict the report to a boundary polygon, the polygon must be selected in the conformance settings. If no polygon is selected, the report will cover the entire extent of the design surface.
-
Switch to either
(Z-Up view) or  (Aerial view). Pan, zoom, and rotate the view until you have the desired view of the data for inclusion in the report.
 -
Make sure a USB key is inserted.
-
Tap the
(Design conformance report) button in the view to generate the report.The report PDF is saved to the folder Maptek Files on the USB key.
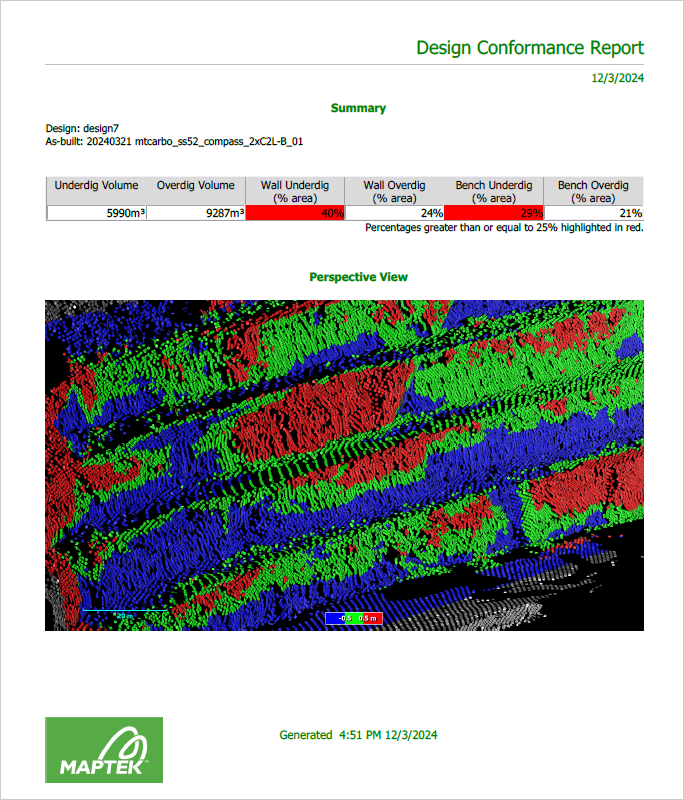
Figure 7-56 Example design conformance report.
The report classifies each part of the as-built covered by the design surface as either wall and bench, and it reports on these as follows:
-
Underdig volume: The total volume of the as-built surface above (or in front of) the design surface.
-
Overdig volume: The total volume of the as-built surface below (or behind) the design surface.
-
Wall underdig: The area of the as-built classified as both wall and underdig, expressed as a percentage of the total wall area.
-
Wall overdig: The area of the as-built classified as both wall and overdig, expressed as a percentage of the total wall area.
-
Bench underdig: The area of the as-built classified as both bench and underdig, expressed as a percentage of the total bench area.
-
Bench overdig: The area of the as-built classified as both bench and overdig, expressed as a percentage of the total bench area.
Note: The volumes express total volumes above or below the design surface and do not take into account any tolerance value. The wall and bench underdig and overdig area calculations take into account a tolerance value of ±0.5 m. That is, parts of the as-built surface within 0.5 m of the design are considered to be within tolerance and are not classed as underdig or overdig.
