Dashboard
Source file: dashboard.htm
The dashboard allows the monitoring run-of-mine statistics by displaying one or more widgets. The default dashboard panel acts as the MaterialMRT landing page upon logging in. Users from administrators and operators across a range of roles can create their own dashboards, and even share them with other users. MaterialMRT also supports multiple dashboards, and they can be exported to a JavaScript Object Notation (JSON) file.
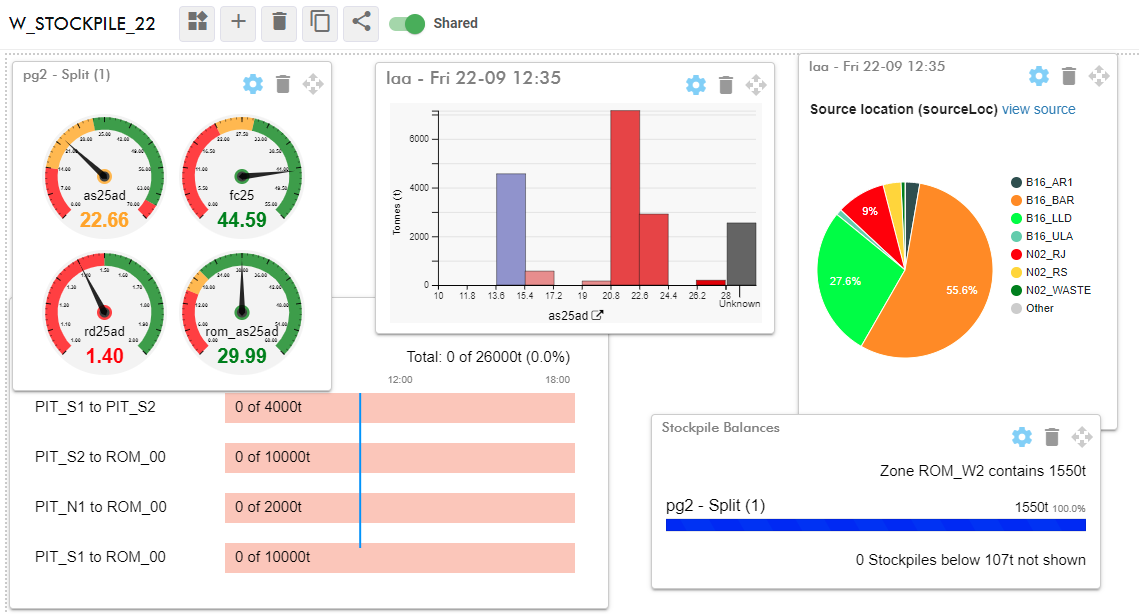
The key components of a dashboard are its widgets. Widgets display information in the form of gauges, pie charts, line plots, and histograms. The readout type is determined by the type of widget chosen. To learn more about creating and using widgets, see Widgets in this page.
Dashboard toolbar
The Dashboard controls are located in a toolbar along the top of the dashboard. They allow you create and manage dashboards, create widgets, import, and export dashboards.

Renaming a dashboard
The dashboard name is located at the top-left of the dashboard panel. To rename the dashboard, click the name to make it editable and type the new name. To save the new dashboard name, click  , or click
  to not proceed.

Note: The default dashboard can only be renamed by the author of the default dashboard.
Selecting a dashboard
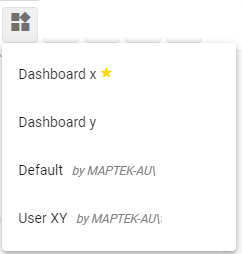
To select another dashboard, click  to expand the select another dashboard drop-down, then click on an available item. The list also provides the following information next to each dashboard’s name (if applicable), as follows:
-
Default dashboard (
 ): When displayed, that dashboard is set as the default.
 -
Shared: This appears next to any dashboard that has been shared by you.
-
By User: This is the recipient of the shared dashboard.
Note: Dashboards shared by other users cannot be edited; the
 button is not available. Use clone dashboard button (
 ) to make an editable version instead.
Creating a new dashboard
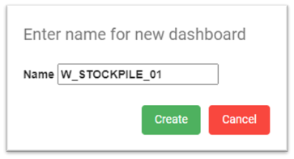
Users may have multiple dashboards. To create a new dashboard click the  button. The Enter name for new dashboard dialog opens. Enter its name and click the
  button to save it. You can now add and configure any widgets.
Deleting a dashboard
To delete the currently displayed dashboard click  . When the confirmation dialog box appears, click the
  button to confirm its removal.
Note: The default dashboard, and dashboards owned or shared by other users cannot be deleted.
Cloning a dashboard
Clone creates a duplicate of the current dashboard. Simply, click  . The Enter name for cloned dashboard dialog appears. Enter its name in the Name field and click the
  button to save it.
Sharing dashboards with other users
To share your dashboard, click the  toggle. When
  is enabled, the word “Shared” also appears next to that dashboard’s name in the select another dashboard (
 ) list. Users can see shared dashboards but they cannot be unshared, except by the original user.
To stop sharing your dashboard, set  to the off position.
Note: When  is active, the share (
 ) button appears in the dashboard toolbar. Click
  to copy the dashboard's URL to your clipboard.
Setting the default dashboard
The default dashboard is shared by default and becomes the landing page when logging into MaterialMRT.
Note: A dashboard marked as default can be seen by all users but it cannot be unshared unless another dashboard is assigned as default by a user with sufficient privileges.
To set the dashboard to be the default, do the following:
- Select the dashboard using the
 (select another dashboard) button.
 - At the top-right click
 , to toggle it to the set to default state. When set, the yellow star appears (
 ) next to the default dashboard in the select another dashboard (
 ) list.
Exporting and importing a dashboard
Dashboards can be saved as JSON files, preserving its resident widgets and made available for other users to import. To export a dashboard, do the following:
- Select the required dashboard from the
 (select another dashboard) button.
 -
Click
 (export to JSON file) at the top-right area of the dashboard panel. The file is immediately saved to your browser’s default download location using the following naming convention:
[Dashboard name][MaterialMRT code ] [Date (DD_MM_YYYY) ] [Time (HH_MM_SS)].json.
Example W-STOCKPILE22GMN 25_07_2022 15_43_18.JSON In this example, “W-STOCKPILE22” is the dashboard name and “GMN” is the site code. Also note the space separating the site code, date, and time.
To import a dashboard, do the following:
- Select the required dashboard from the Select another dashboard list.
- Click on the
 button. An Open... dialog opens.
 - Navigate to the file location of the file and double click open it.
- When the Confirm dialog appears, click
 .
.
When importing a dashboard, any existing widgets and their settings will be overwritten and replaced by the imported settings.
Widgets
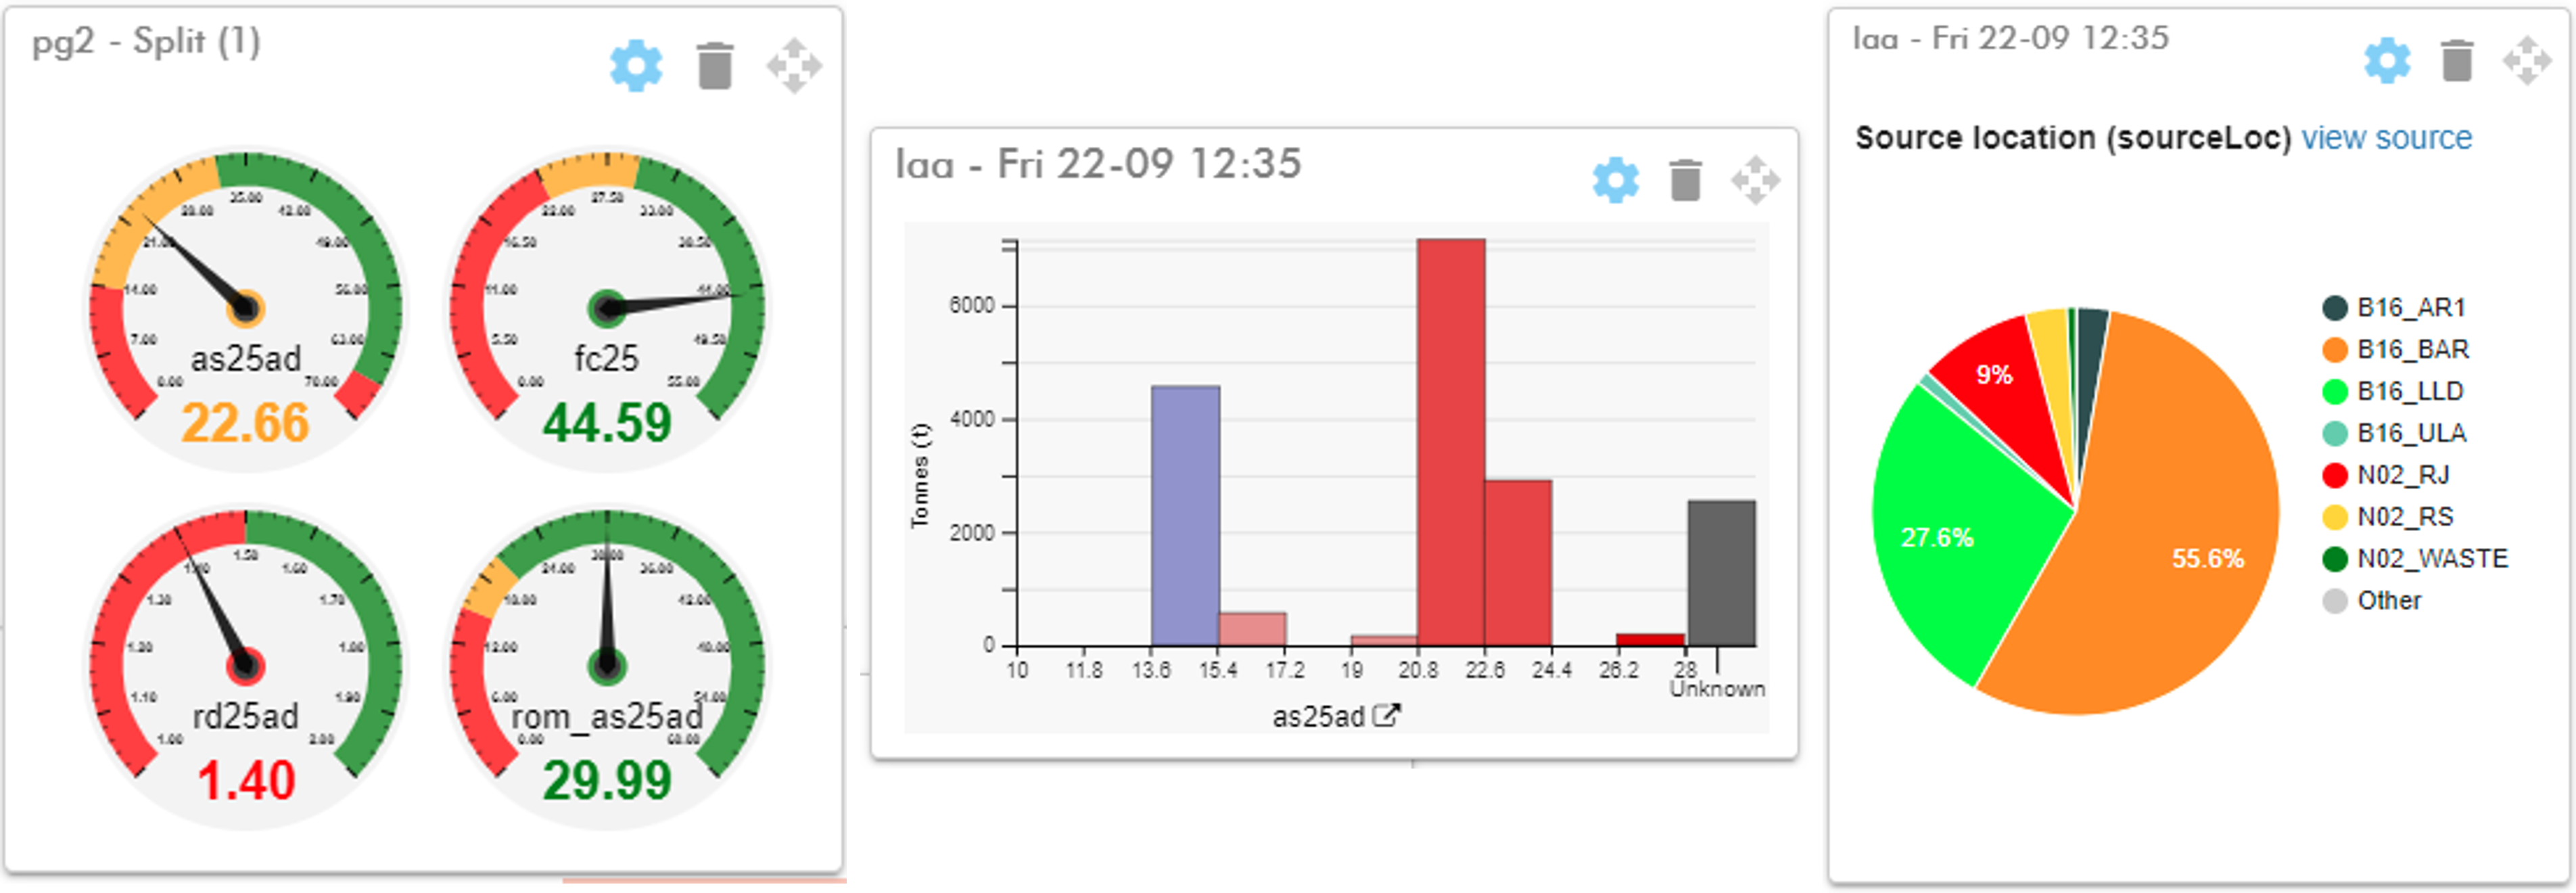
Widgets are small panels containing one or more readouts that reside within the dashboard. Widgets allow you to monitor a selection of properties and other metrics. This information is displayed using specific graphs, gauges, plots and histograms. These readouts use the colour schemes that were set up in the Material Properties Schema page. Some example widgets are shown in the image below.
Adding widgets to the dashboard
You can add as many widgets to your dashboard as you can fit by following these steps:
- Click the
 button located at the top-right of the page and select a widget type from the drop-down list.
 - Configure your widgets. Refer to Configuring widgets for an overview of the widget controls or Setting the required widget properties to configure them.
- Place the widget in the desired location inside the dashboard page, using its drag handle (
 ).
). - Repeat the above steps to add each additional widget.
Tip: Hover over an item in the list to see a sample thumbnail of the widget and the dataset it uses.
Configuring widgets
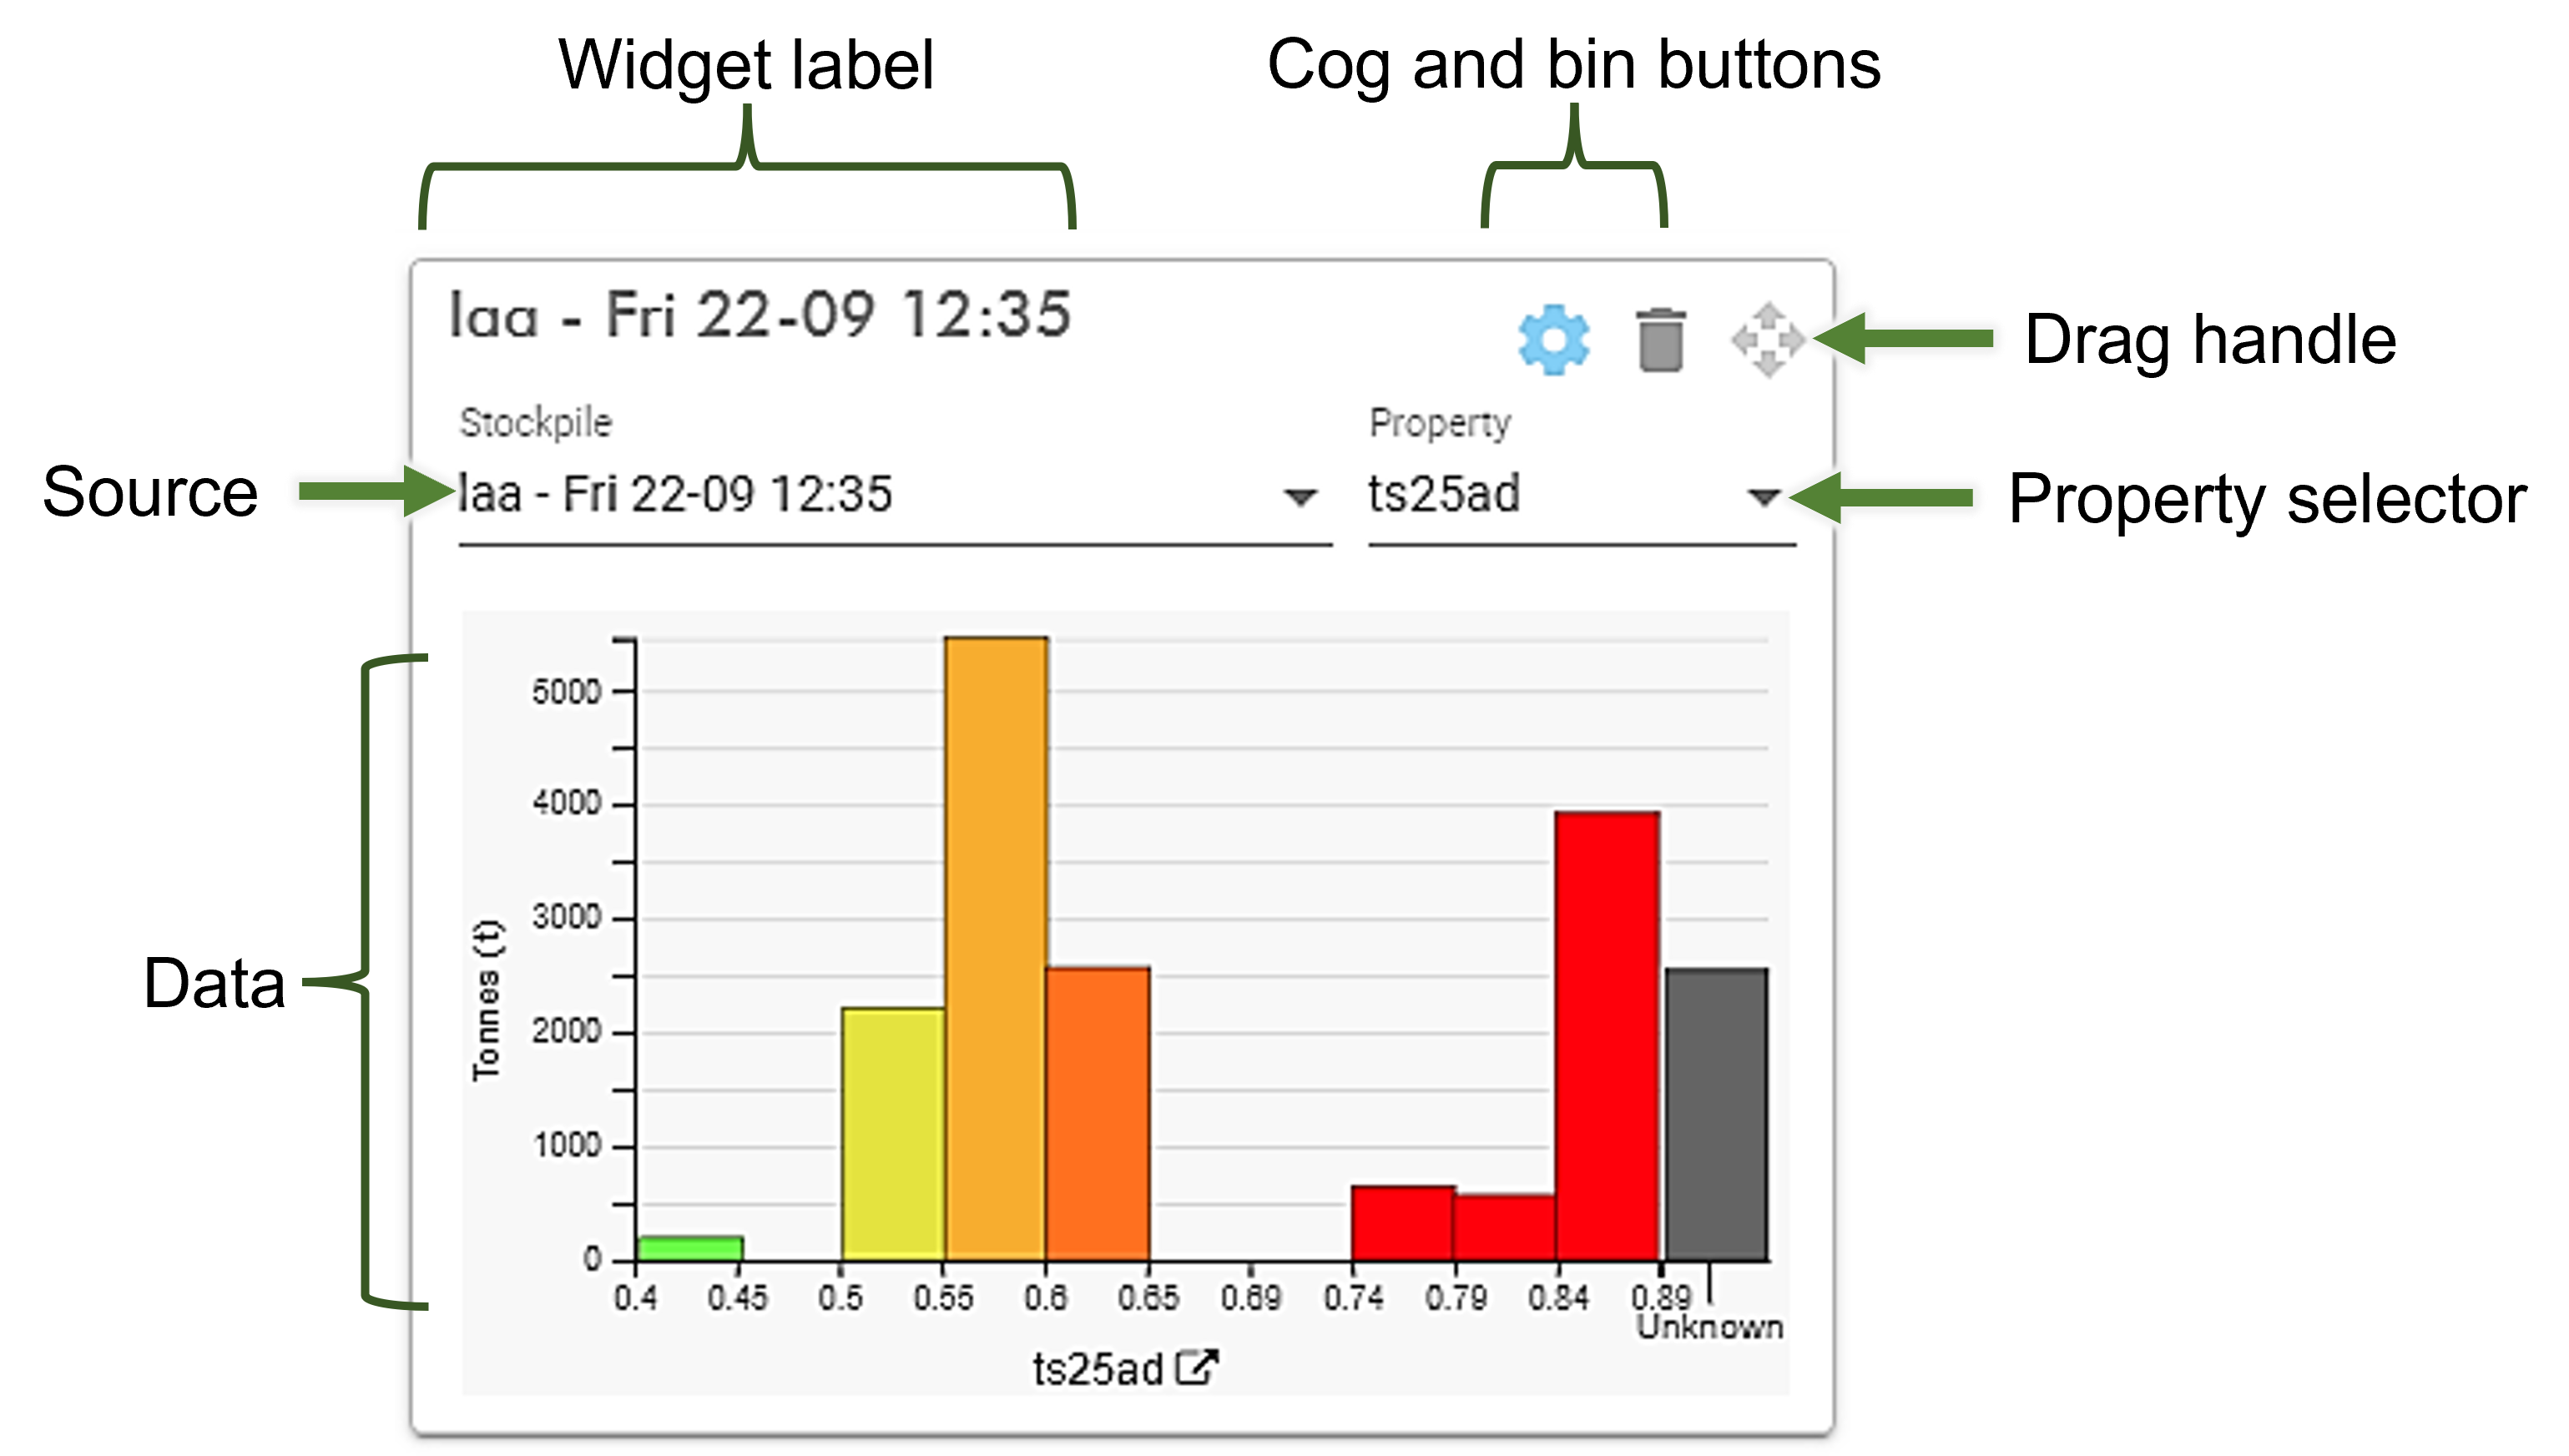
All widgets have a common set of controls. The type of information (data) and the form in which it’s displayed is determined by the selected widget (refer to Setting the required widget properties). The common parts of a widget are as follows:
- The Widget label is associated with a particular stockpile, sink, or report.
- The settings (
 ) button displays or hides the configuration options. For most widgets this may include the following:
- Source. Select a stockpile, sink, or report type.
- Property. The type of property depends on the widget. Properties may include one or more items.
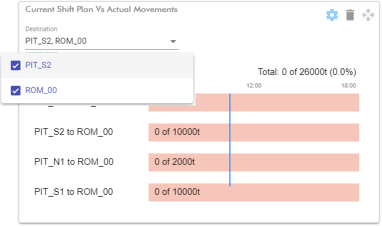
- Remove Widget: Click
 to immediately remove that widget.
 - Readout: This window displays the data as it’s received from the system.
- View or View Source (where available): Click on the hyperlink to display its source data or location in a separate browser page.
- Drag handle: Click on
 while holding down the right-hand mouse button to move a widget to a specific location in the dashboard page.
Setting widget properties
To configure your widget, do the following:
- Add a widget to your dashboard, see Adding widgets to the dashboard.
- Click
 to reveal your configuration options.
 - Select your source its drop-down.
- Select your properties from its drop-down.
- Click
 to hide configuration options (you can leave this open if you prefer).
