Viewer
Source file: viewer.htm
The viewer page combines terrain photography with stockpile models, grade control blocks, and zones within the mine site. The viewer has the following features:
-
The Viewer: Visualise the terrain and its specific features. The view can be panned, rotated, and zoomed using your mouse to see stockpiles, geological, and grade-control blocks from any perspective. To learn more, see Using the viewer. You can also control what you see in the viewer, to learn more, see Configuring the viewer.
- The details pane: Click on a stockpile to open this panel. View details about the selected stockpile or zone. The details pane includes tools to reclaim material or edit the properties of a stockpile or a selected area. To learn more, see Using the details pane tools.
- Stockpile statistics and management: The viewer provides the tools to create and examine cross sections, split stockpiles, make area selections, and move materials to a different location. To learn more, see Viewer application buttons.
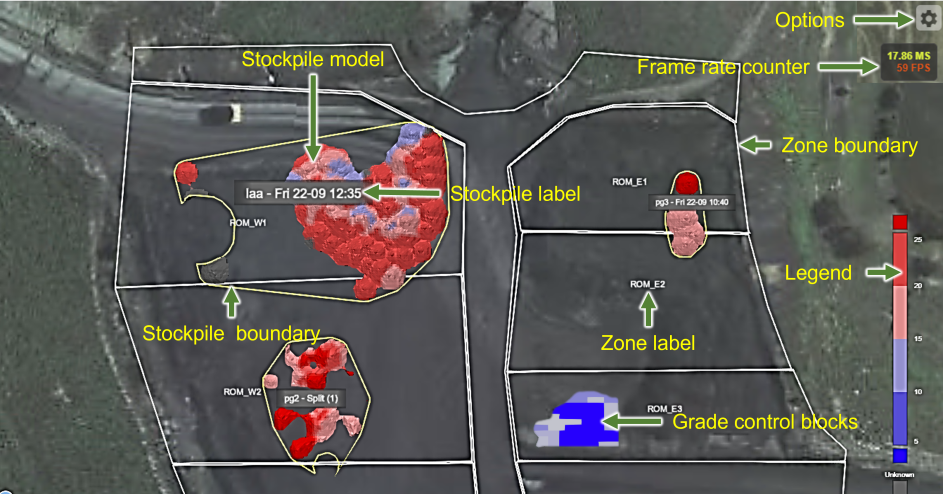
Configuring the viewer
The viewer can be customised to show or hide different features. By default, the viewer displays a world map (Bing Maps), localised imagery (Cesium ion ), zones, stockpiles, and grade control blocks. In addition to this, you can control which details are displayed in the view.
When you first open the viewer page, the terrain is shown from a plan-view perspective. Depending on your settings, the following features may be displayed:
-
Assets (localised imagery, for display in Cesium ion)
-
Zones (or specific zone categories)
-
Stockpiles (and specific features)
-
The world map (using Bing Maps)
-
Custom terrain (such as terrain scans)
To configure what you enable or see in the viewer, click  to open the Options pane. These options are as follows:
-
Viewer Assets: This section is where you select to enable your local imagery. Click the
 button to expand the section and use the checkbox to select available assets. Users can also add additional assets and topographical data (from the Cesium ion server), following these steps:
-
Click in the Add asset... field. In the dialog that opens, enter the Asset Name and Asset ID.
-
In the Type drop-down, select Terrain or Imagery, depending on the dataset.
-
Click
 to include the asset.
-
-
Zone: Show, hide, or select specific zones categories to be displayed, as follows:
-
Show Zones: Enable the toggle switch to show zones.
-
Select zones to include when Show Zones (
 ) is enabled. Expand the drop-down (
 ) to list the zone categories. Use the checkboxes to select which zone categories to display.
-
-
Stockpile: Configure how stockpiles are displayed by setting the following options:
-
Minimum area to show stockpile: Enter the minimum area a stockpile needs to occupy for it to be displayed.
-
Show Stockpiles: Toggle to show or hide all stockpiles.
-
Show Stockpile Labels: Enable the toggle switch to display stockpile labels.
Note: If this toggle is disabled, Show Stockpile Details is also disabled.
-
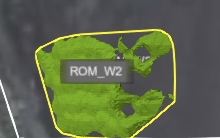
-
Show Stockpile Details: Enable the toggle stockpile details to include up to three material properties. Expand the drop-down (
 ) and select the preferred properties to display.
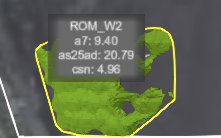
Note: If a selected property is not present within the stockpile, it will not be displayed in the label.
-
Show Stockpile Boundaries: Enable this toggle to show boundaries (the yellow borders around the stockpile).
-
-
Grade Control Model: This section configures how grade control blocks are displayed.The options are as follows:
-
Show Grade Control Model: Enable this toggle to display grade control blocks.
-
Model: Expand the drop-down and select an available model.
-
Colour by Property: Expand the drop-down to select a property type with its associated colour scheme.
-
-
General: Configure the following general terrain options:
-
Show World: Enable this toggle to use Bing Maps imagery.
-
Resolution Quality: Select High to allow the browser to determine the ideal performance and resolution. Select Max to ignore browser-imposed restrictions.
-
Terrain Type: Select Basic to display the default Cesium ion terrain. Select Custom to display imported terrain scans.
-
Show Frame Rate Counter: Enable this toggle to display the refresh and frame rate beneath the viewer settings cog (
 ).
).
-
-
Save: Tap the
 button to close the panel with your updated settings.
Using the viewer
The basic purpose of the viewer is to display topographical imagery, zones, stockpiles, and grade control blocks. As run-of-mine activities occur, the stockpiles form and change as material is added or removed. The viewer’s tools allow you to obtain and modify information relating to stockpiles and grade control blocks. These are described in the following topics.
Viewing content in the details pane
There are two ways that you can open the details pane: click on a stockpile, or right-click on a stockpile and select View details.
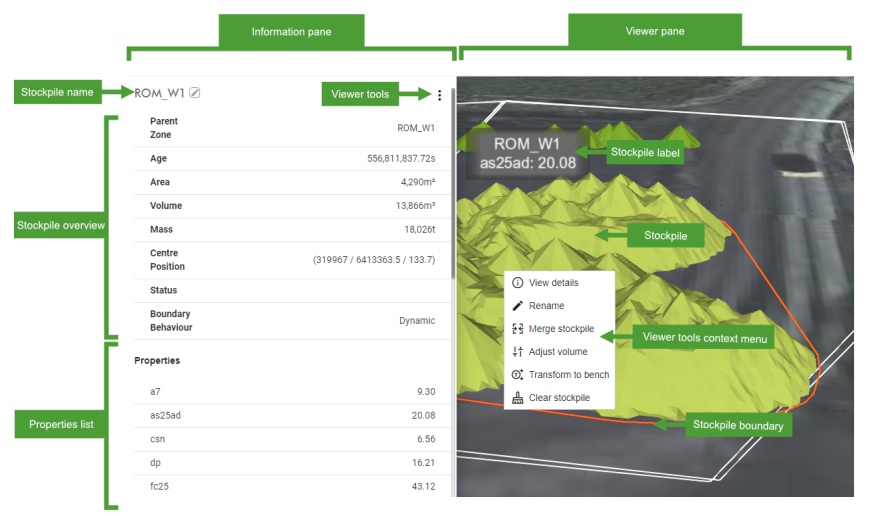
The details pane consists of the following:
- A stockpile overview with the following information:
Stockpile Name: Displays the stockpile name. You can edit the name. Simply click on the text to enable the mini editor, type in your new name, and click on
 to save it or
  to cancel.
Tip: Alternatively, right-click on the stockpile and select Rename from the context menu, then enter the new name into the New Stockpile name dialog box and click
 .
.- Parent Zone: The zone where the stockpile is located (by its centre position).
- Area: The total area of the stockpile calculated by MaterialMRT.
- Volume: The total volume of the stockpile calculated by MaterialMRT.
- Mass: The total mass of the stockpile calculated by MaterialMRT.
- Centre Position: The coordinates of the centre area of the stockpile.
- Status (optional): Used as a flag to indicate an arbitrary condition such as surveyed, empty, building, etc.
- Boundary behaviour: Indicates whether the boundary is dynamic or static.
-
The Material property list: Any properties associated with the stockpile are shown here. The material properties list also allows you to do the following:
-
Use the mouse wheel or scroll bar to view off-screen items.
-
Hover over a property with your mouse pointer to display pop-up statistics. Grade control and other numerical properties are shown as tonnage v grade histograms and text properties are typically shown as pie charts.
Note: Clicking on a non-stockpile zone such as a waste dump does not automatically load a material property list but you can generate one by clicking on the
 button.
Tip: To close the stockpile details pane, click
 at the top right-hand side of the details pane, or click outside of a stockpile or zone boundary.
-
Using the details pane tools
Four tools allow you to interact directly with a selected stockpile, they are: Merge stockpile, Adjust volume, Transform to bench, and Clear stockpile. To access any of these tools, use either of the following approaches:
-
Click on the
 button at the top of the details pane.
 -
Right click on a stockpile to open its context-sensitive menu.
Merging Stockpiles
Merging allows two adjacent stockpiles to be combined into a single area, the stockpile boundary follows the extents of the combined stockpile model. To merge a stockpile with another, do the following:
-
Select the stockpile you want to merge using either mouse button.
Note: The first stockpile you choose in this sequence will assert its name to the overall merger. The second stockpile name is overwritten.
- Select
 , then click on the stockpile to be merged; a confirmation box opens.
 -
To complete the merge, click the
 button. When the success confirmation appears, click
  to close it. The stockpiles are combined and the boundary is updated.
Adjusting the stockpile volume
The volume of a stockpile can be adjusted immediately, or at a specific time. For example, a surveyor determines the actual volume and later submits an update for correction. The operator then uses this data to update MaterialMRT.
To adjust the stockpile volume. do the following:
- Select the stockpile you want to adjust using either mouse button.
- Click
 ; the Adjust stockpile volume dialog opens.
 - In the New Volume(unit³) field, the current volume is displayed. Enter the new volume in this field.
- Choose when the change takes effect by selecting one of either radio button:
- Select Now for the change to take effect immediately.
- Select In the past and enter the date and time directly into the As of field. Alternatively, use the calendar picker (
 ) .
) .
- Click the
 button to complete the task, or
  to not proceed.
Transforming a stockpile to a bench
Material that is dumped using the MaterialMRT modelling algorithm produces structures that are conical and follow the predicted behaviour of material when settling. In reality, stockpiles are shaped by earthmoving equipment that typically form ramps and benches at the top of the stockpile that are surrounded by bunds. This tool models the stockpile to include these features.
The estimated height of the bench depends on determining the average height of the stockpile mass and its area —while the bund height is determined by site operator. If the bench height is set too high, little to no effect may occur and you will need to repeat the process. If the bench height is set too low, the stockpile may become overly flattened and force the surface area at the base of the stockpile to increase.
To use the transform to bench tool, follow these steps:
-
Select the stockpile to transform to a bench using either mouse button.
-
Click
 , the Transform Stockpile Options dialog opens.
 -
Enter the bench height and maximum bund height into their corresponding fields.
-
Click the
 button to complete the task, or
  to not proceed.
Clearing a stockpile
When a stockpile is cleared, any material properties are also removed. If the action occurs at a time in the past, MaterialMRT rewinds the system to that point in time and replays events that exclude the removed stockpile.
To clear a stockpile, do the following:
- Select the stockpile you want to clear using either mouse button.
- Click
 ; the Clear stockpile dialog opens.
 - Choose when the change takes effect by selecting one of either radio buttons:
- Select Now for the change to take effect immediately.
- Select In the past and enter the date and time directly into the As of field. Alternatively, use the calendar picker (
 ).
).
- Click the
 button to complete the task, or
  to not proceed.
Viewer application buttons
The viewer application buttons are a group of separate tools located along the top of the viewer. They allow you to perform various actions, as follows:
|
|
Create a cross section to view and examine the details of the stockpile. To learn more, see Making a stockpile cross section. |
|
|
Split stockpiles using a polygon to create your demarcation. To learn more, see Splitting a stockpile. |
|
|
Create a polygon over an area of interest to discover details about the underlying area. You can also Reclaim an amount of mass, Edit Properties within the selected area or Clear Material within that selection. To learn more, see Using the select area tool. |
|
|
Use this tool to transfer material from one location to another. To learn more, see Moving material in a stockpile to another location. |
|
|
Choose the preferred stockpile colour scheme. Select from Coloured by Height, Vertical Column, and Stockpile. When Vertical Column or Stockpile is selected, open the Metric drop-down to choose one. The preferred colour scheme legend is shown at the bottom-right of the viewer, and all stockpiles are coloured accordingly. |
|
|
Recentre the view: Click the button to reorient the bearing of the terrain to its default and the tilt to plan view. |
|
|
Zoom To opens a list containing all zones inside the terrain map. You can do any of the following:
|
Using the cross section tool
Cross Section allows you to create a section (P1 - P2) across any area containing stockpiles. The cross section produces an elevation of your stockpile that you can examine in detail. To create a cross section, follow these steps:
- Click
 , the prompt Click where the cross section should start appears at the top of the viewer.
 - Position the stockpile near the centre of screen. If necessary, use your zoom to control your field of view over the stockpile.
- Move your mouse to the required start position (P1) and right-click to anchor that point.
- Move your mouse to where the cross section should finish (P2) and right-click to set your cross section. A graph of Height versus distance from P1is displayed inside the viewer. Each plot represents the highest cuboid in the stack.
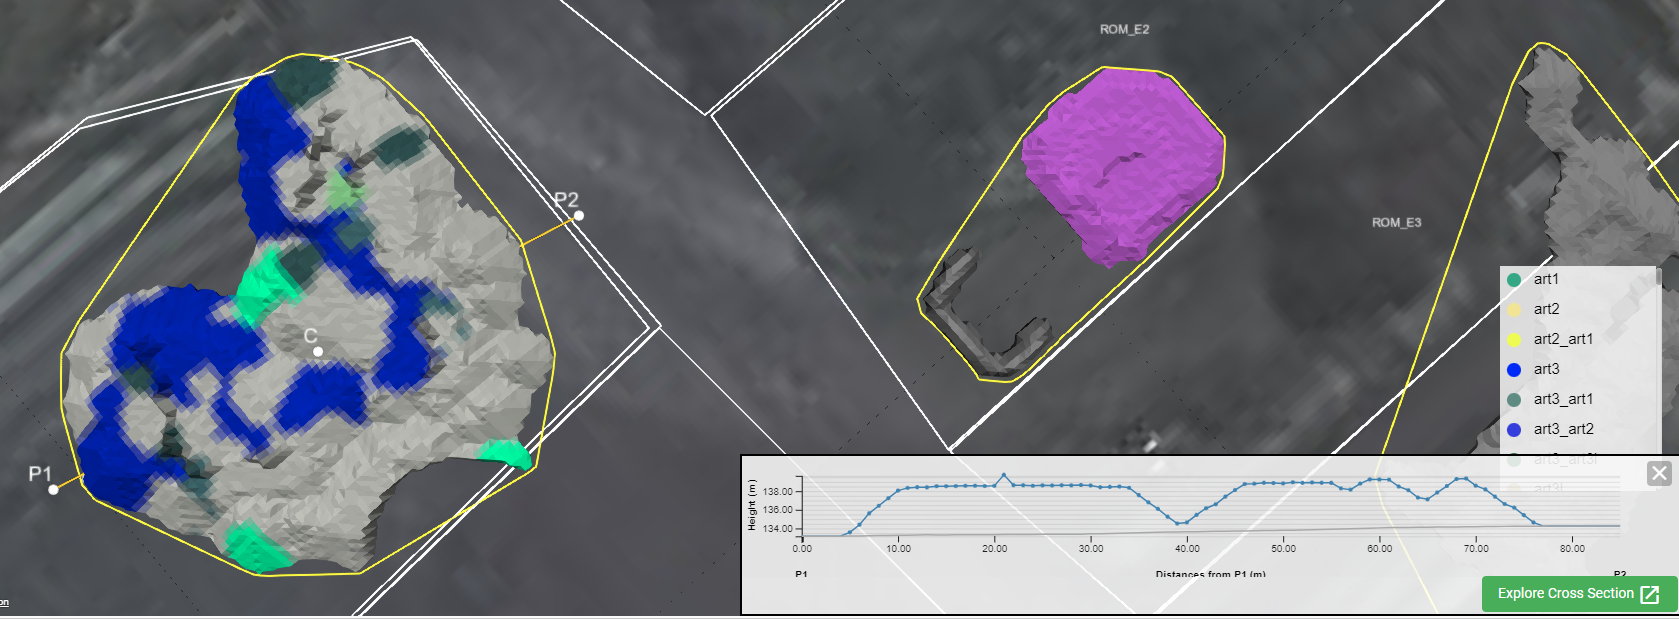
Note: You can drag the Points P1 ,P2, or C to adjust the path of the cross section as required. Dragging the centreline (C), moves the entire cross section line without changing its orientation. To examine the cross section in more detail, click the  button. This opens a new browser page that allows you to view the cross section in more detail. To learn more, see Exploring a cross section.
Exploring a cross section
To view the cross section in detail, click the  button inside Height versus Distance from P1 graph, this opens a new browser page called Cross-Section. The cross section page is divided into three sections: the Graphing type options, the viewer pane and a larger Height versus Distance from P1 graph.
Configuring the graphing type controls
Graphing type controls how your block form data is displayed. Select either of the following:
- Raw: The Cuboid Length and Width parameter setting in the Application bar’s Site Parameters .
- Averaged uses unit blocks that are averaged and combined into a single block. To set the block size enter the value in the Resolution field.
Raw graphing is using the Cuboid Length and Width. In this case, the cuboid is 1 m wide (remember that a cuboid does not have a set unit height).
When Averaged graphing type is used, the block size is set by the Resolution parameter. In this example, the value is set to 2x2 m (note that a vertical dimension is required to form a uniform block). Each 2x2 m block may contain cuboids (or part of) within each block. The average of the combined cuboids are determined and applied to each block. Refer to the comparison, below.

Tooltip properties
You can control the amount of details that are included in the tooltips when hovering the mouse over a cuboid. Select either of the following:
-
Show all: When selected, an overview of the cuboid (Distance from P1, height, width, and mass), and a list of the material properties statistics are displayed.
-
Show selected: When selected, the following items are displayed:
-
Distance from P1: This is the horizontal distance of the cuboid from P1
-
Height: If the Graphing type is to Raw, the cuboid height applies. If Graphing type is Averaged, the height of the block is set by Resolution.
-
Width: If Graphing type is Raw, the cuboid width applies. If Graphing type is Averaged, the width of the block is set by Resolution
-
Value: The value of the averaged material property in a block. When viewing a text property, this is the percentage of the 'Highest Component
-
Highest Component: This is the dominant component. This heading only appears in text properties.
-
Components: When using averaged graphing, any material properties and their proportions are listed.
ExampleIn this example, setting Resolution to 3 causes a 3 x 3 m block to include the components lid5b (71.1%), lid6 (11.1%), and pg3u2 (17.8%)
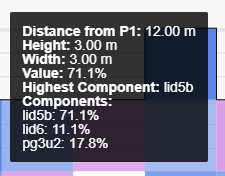
-
Adjusting the cross section in the viewer
If required, you can continue to make adjustments to section P1 - P2, and C by dragging any of its anchor points. The graph profile plots are updated to reflect the new cross section.
Selecting a metric
A metric is a particular property in the stockpile. Refer to Material Properties Schema in User and System Management > Site Configuration Options > Material Properties. Select an available property from the Colour by metric drop-down. The graph is updated to reflect the selected colour scheme.
Structure of the cross section graph
The shape of the cross section models the deposition of material by location and the attributes of the materials which are set in the Cuboid Stack Modeller Settings in User and System Management > Site Configuration Options > Site Parameters.
The graph is represented in two basic ways, being:
-
A profile that follows the height of the stockpile over the cross section. Each point in the profile represents the height of the sample distance from P1.
-
The cuboid blocks representing the chosen metric by their properties (see above topic Selecting a metric) and composition. A cuboid is a block with a set width which is defined in Global Settings in User and System Management > Site Configuration Options > Site Parameters. The cuboid height directly relates to the metric property value, such as percentage, tonnage, TipStatus, etc.
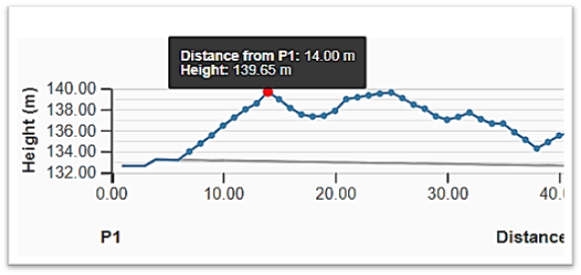
Profile graph of the stockpile subdivision through the line P1-P2.
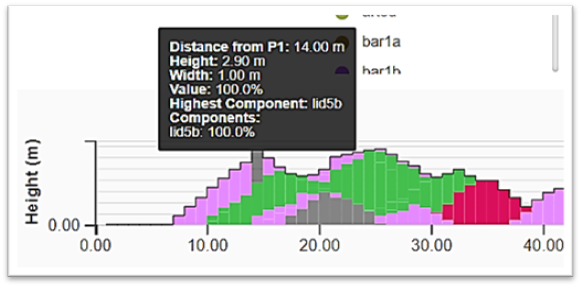
Cuboid block graph with the seam text property selected.
Viewing tooltip information
Information is contained within each cuboid block or plot on the graph. Simply hover your mouse pointer over an individual block or plot. The plot or cuboid block is highlighted and an information tooltip appears. In the case of a plot, this the distance from P1 and Height. If a cuboid is selected, its properties are displayed. The contents of the tooltip depend on the Tooltip properties setting.
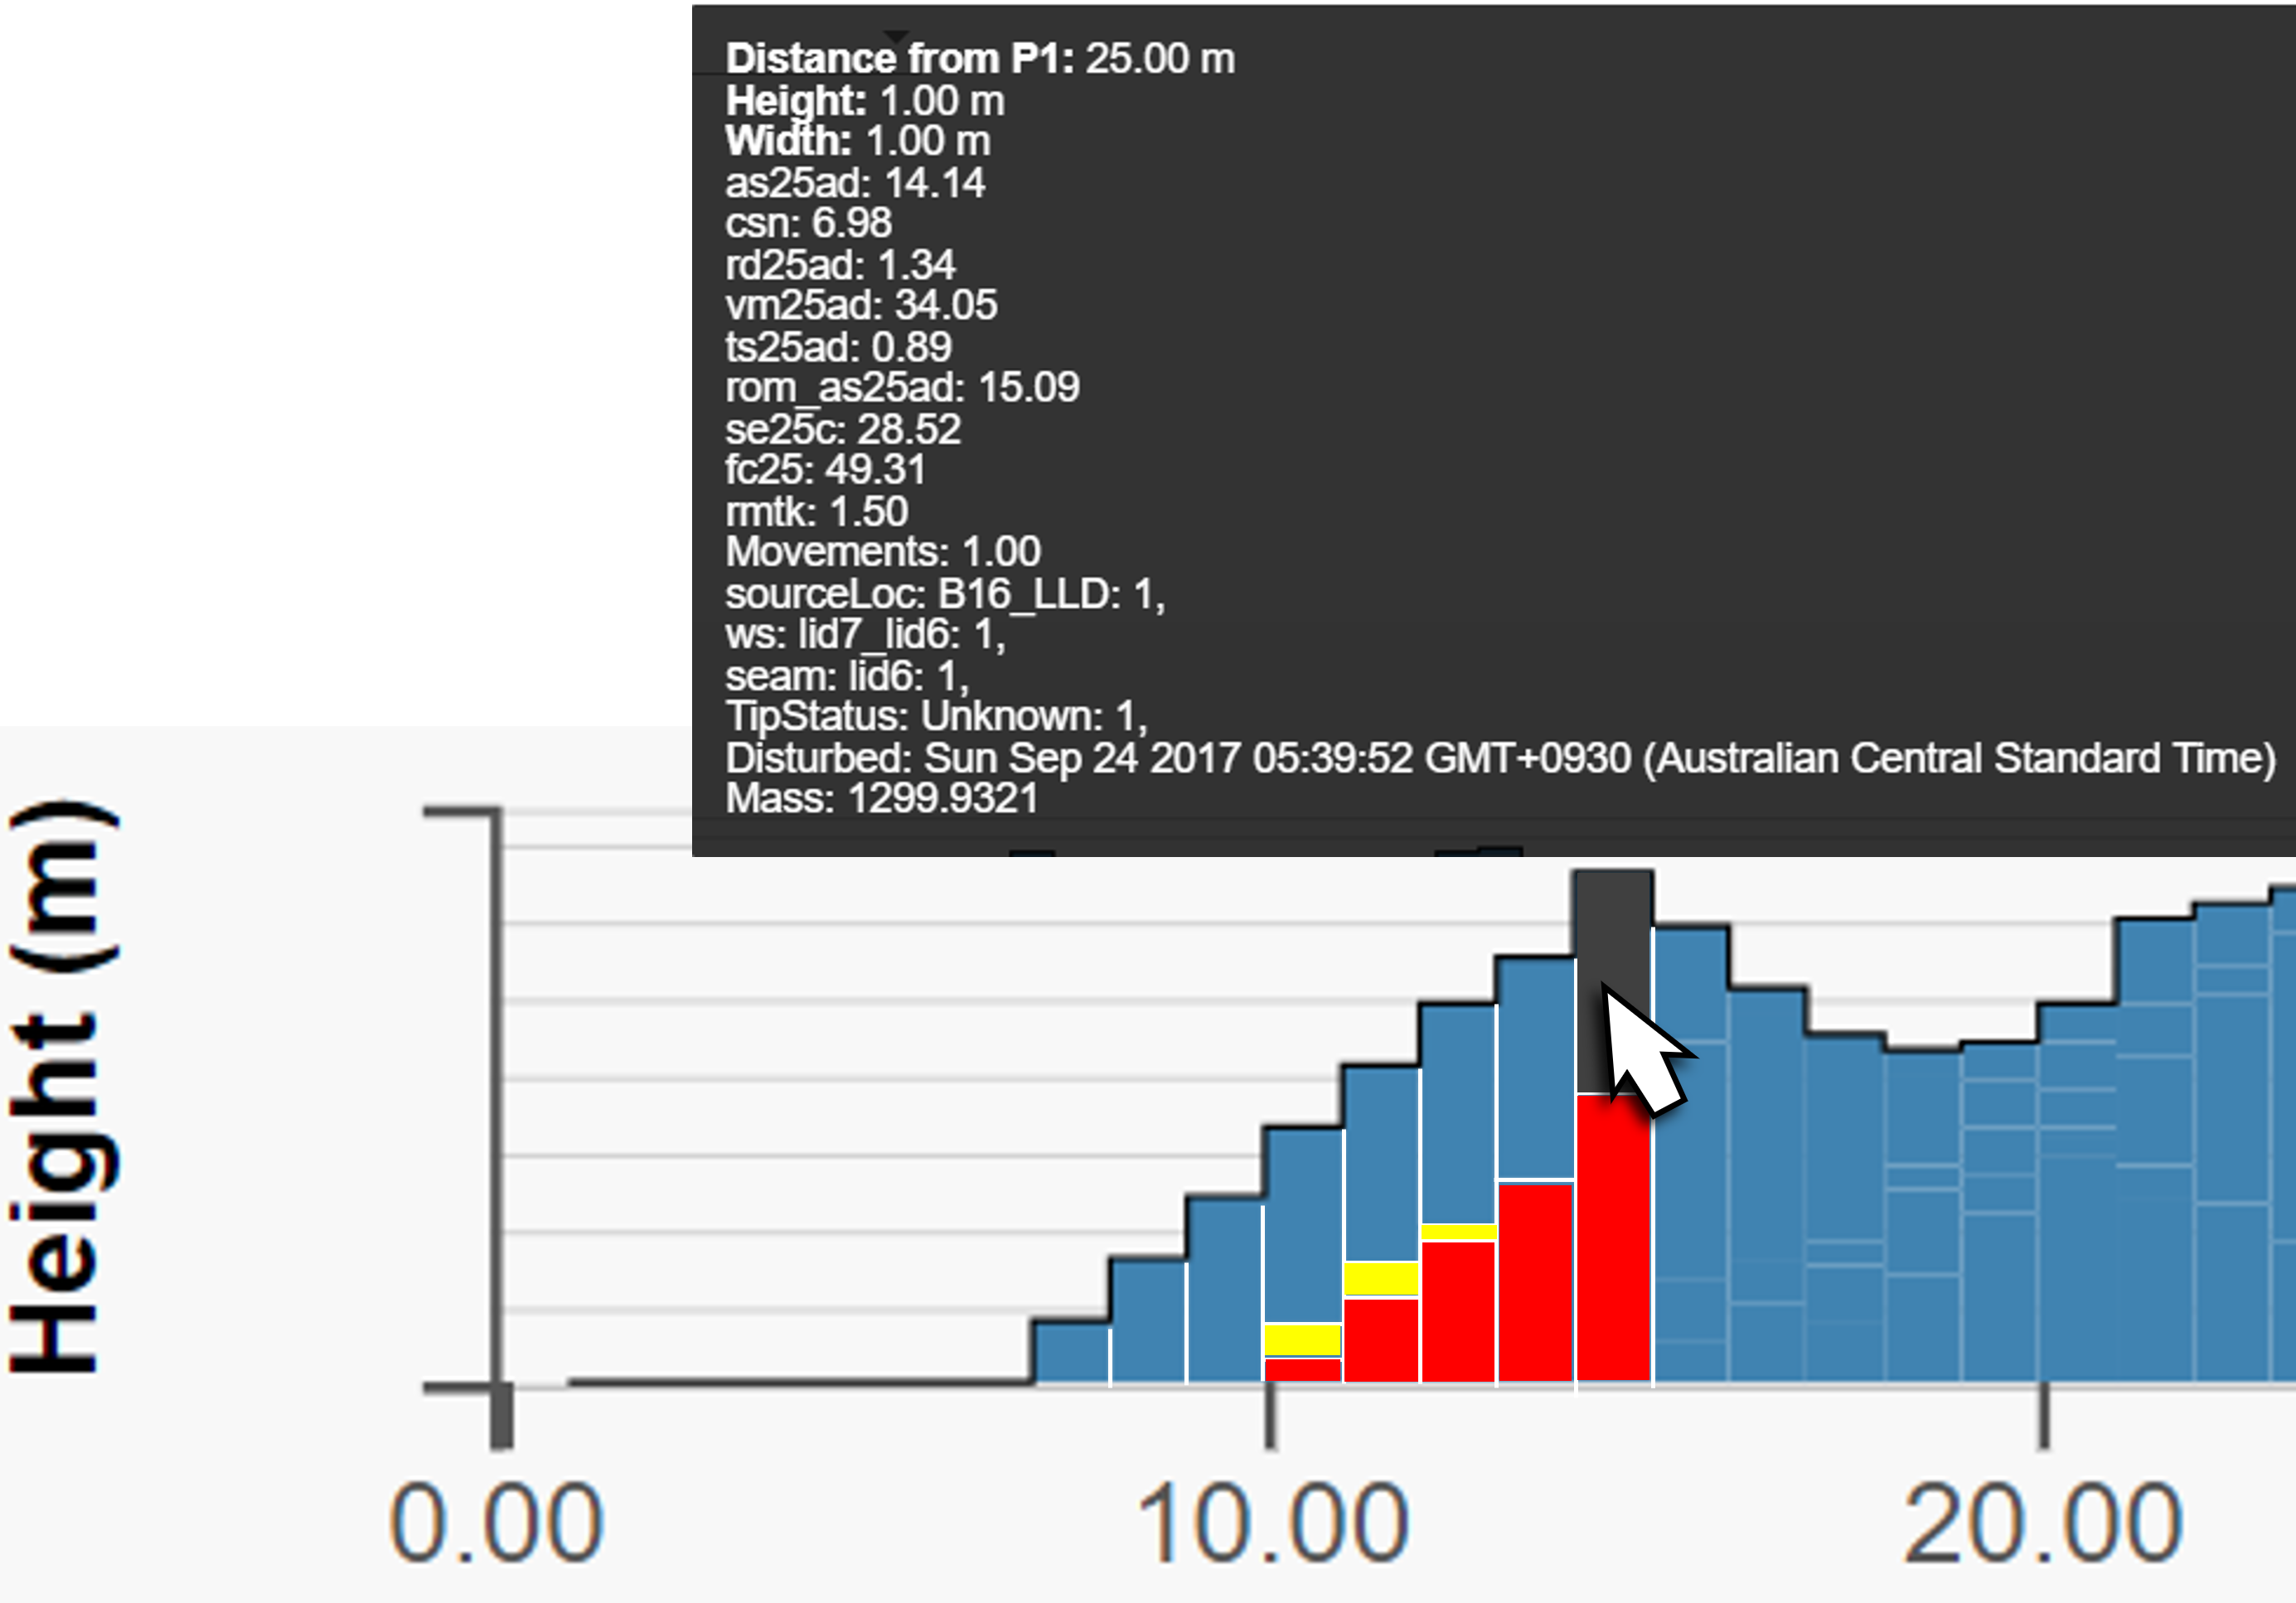
Blocks that are stacked above others are representative of subsequent dumps of materials into that stockpile.
Splitting a stockpile
Stockpiles change with the movement of material. In some cases, it may be practical to separate an existing stockpile into two separate stockpiles. The Split Stockpile tool allows you to select the area to split and then allocate a name for the new stockpile. The process is as follows:
-
Manipulate the view so that the area to be split is easily seen.
See also: View manipulation (panning, rotating and zooming) in Getting Started > Viewer controls.
-
Click the
 button to start the tool. The prompt Click to add new points Press Space to finish appears and the mouse pointer changes to a cross.
 -
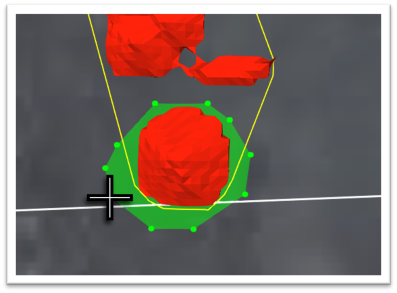
Create a polygon around the area that you want to separate from the current stockpile boundary.
See also: Making polygons to create an area or zone in Getting Started > Viewer Controls.
-
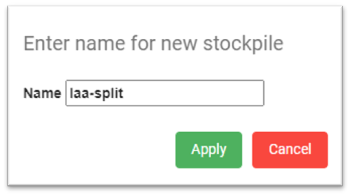
When the perimeter is set, press Space to exit editing mode. When the Enter name for the new stockpile dialog appears. Enter the new name in the Name field and click the
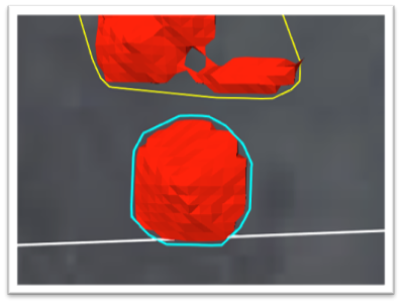
 button. The stockpile boundaries are updated as shown below.
Once the stockpiles are split, the stockpile borders are dynamically adjusted as shown in the example below:
Using the Select Area tool
The Select Area tool allows you to create one or more polygons in your view. By creating an area, you can review information relating to this particular area. Additionally, two other functions appear in the details pane. They are Reclaim and Edit Properties.
How to select an area
-
Manipulate the view so that the area to be split is easily seen.
See also: View manipulation (panning, rotating and zooming).in Getting Started > Viewer controls.
-
Click
 to start the tool, the prompt Click to add new points, Press space to finish appears and the mouse pointer changes to a cross.
 -
Create a polygon around the area that you want to see the details for.
See also: Making polygons to create an area or zone in Getting Started > Viewer Controls.
-
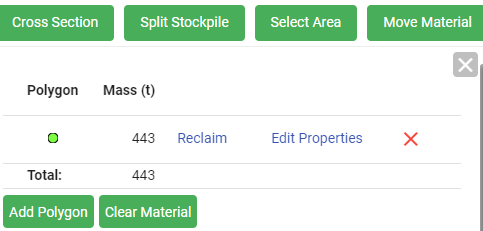
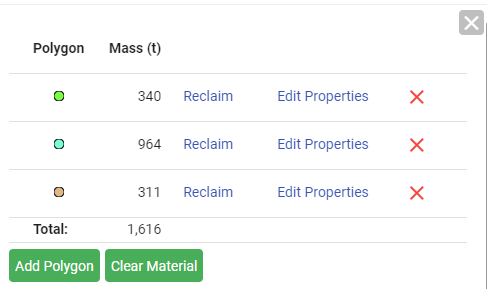
Press Space to complete the polygon, the details pane opens, displaying its polygon colour, mass, reclaim and edit properties hyperlinks (acting as buttons), and the remove polygon button (
 ) in a single row. If more polygons are added using the
  button, they are added to the list, as shown in the image below.
Note: Use the
 button to create your first polygon, then use the
  button to make additional polygons following the previous steps in this section.
Tip: If the details pane is closed, click on any polygon to open it again.
TipThe Properties list below your polygons list contains statistical information for the present properties.
Hover over a property to reveal that property’s statistics.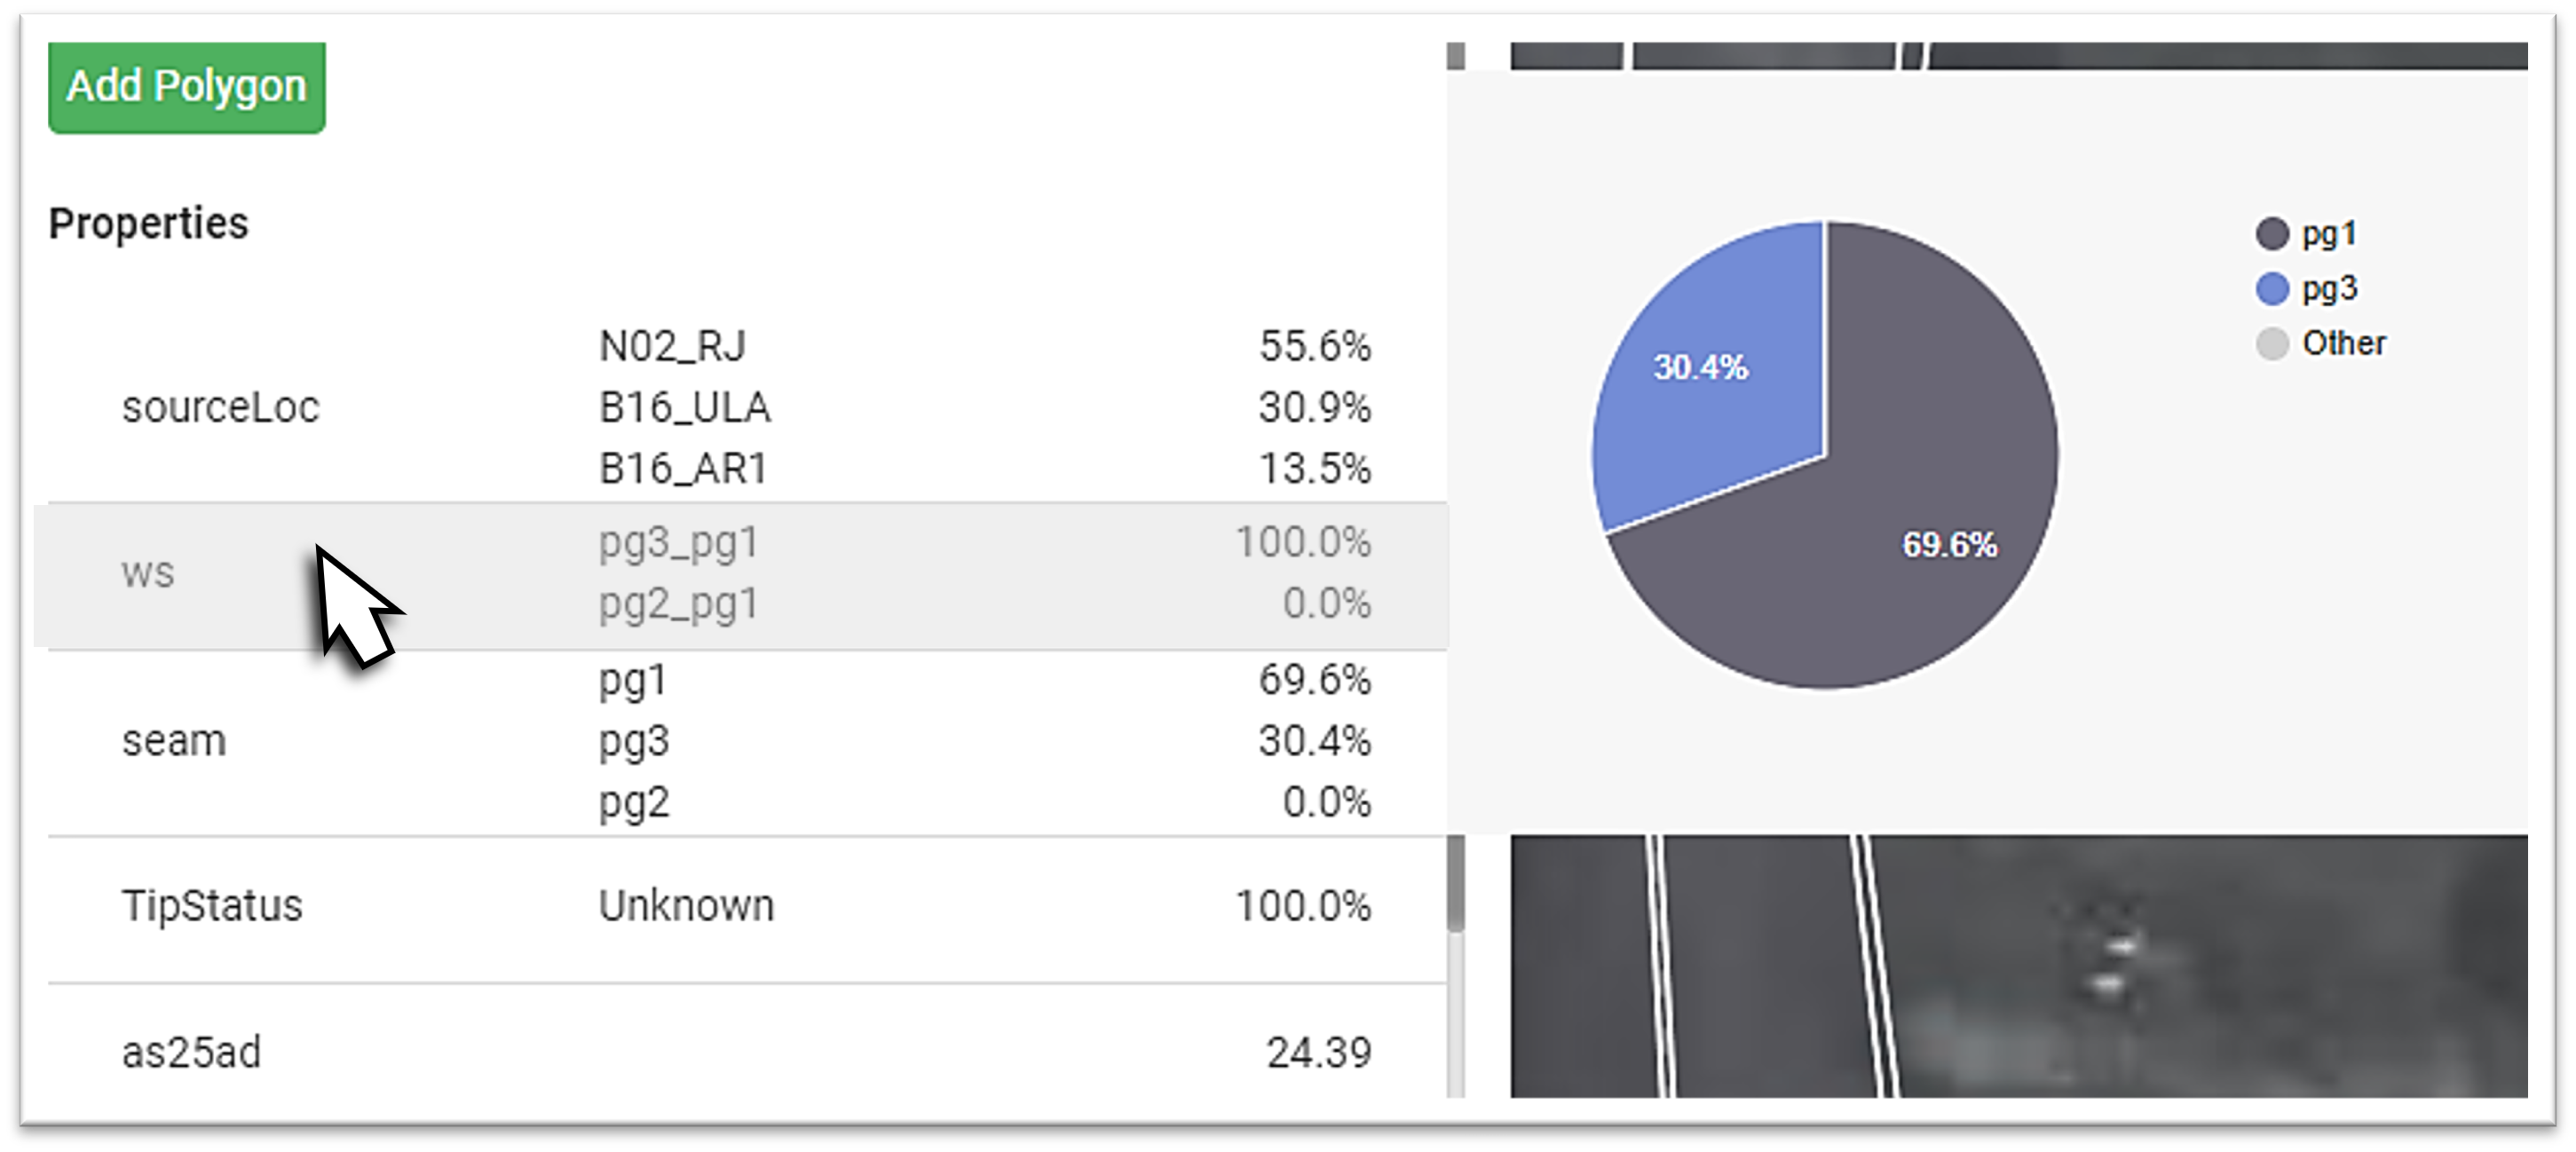
Reclaiming materials
Reclaiming is the process of adjusting material quantities from a stockpile (selected area) so that material is allocated to the appropriate sink, such as a crusher. To initiate a reclaim of material, do the following:
-
Click on Reclaim. The Reclaim Options panel opens.
-
In the Date Range field, use the calendar picker (
 ) to select a date or period of time, then click
  .
. -
In Mass to Reclaim, enter the value to be reclaimed. If you are reclaiming the entire mass, retain the current maximum value.
-
In Mass per Load, enter the tonnage to be extracted per trip, based on the truck’s capacity.
-
In Digger Name, enter the name of the digger.
-
In Truck Name, enter the name of the truck.
-
Click to expand the Destination drop-down and make your selection.
Tip: To exit Reclaim Options at any time, click on the
 button.
 -
Click
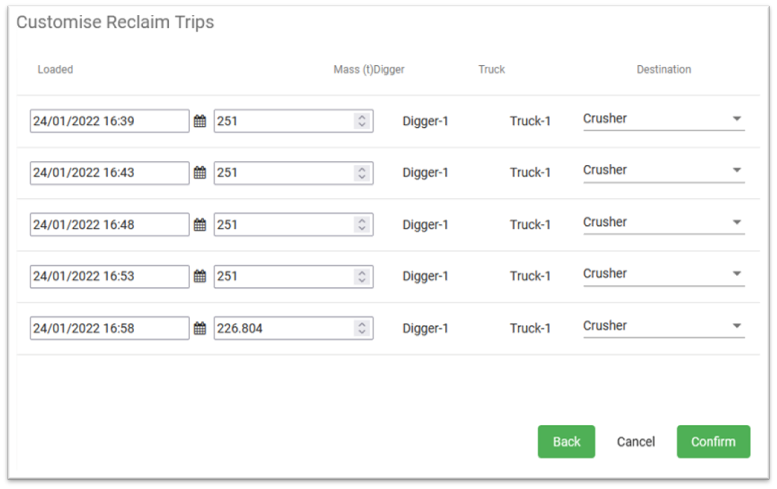
 , the Customise Reclaim Trips panel opens. A table listing the trips required are shown. You can refine the same parameters used in Reclaim Options for individual trips, including different destinations. To accept your settings, click
  . Otherwise, click
  to return to the Reclaim Options dialog or click
  to not proceed.
Editing selected area properties
Adjustments can be made to a high level of detail using the Edit Properties tool. In the Properties editor, you can do the following:
-
Substitute a listed property using the drop-down (
 ), next to that property.
 -
Change a value of a selected property.
-
Delete a property.
-
Add a new property, if available.
In the diagram below, there are no Text properties that can be added. The Add button is greyed out because all the available properties are already listed in this section. There are no more properties of this type to add.
Also, there are no user-configured List properties defined in the Material Properties Schema, so its Add button is greyed out because no list properties that can be added.
There are two available Numeric properties (Au and Au20) in the Material Properties Schema. So they can be added if necessary, as indicated by the  button.
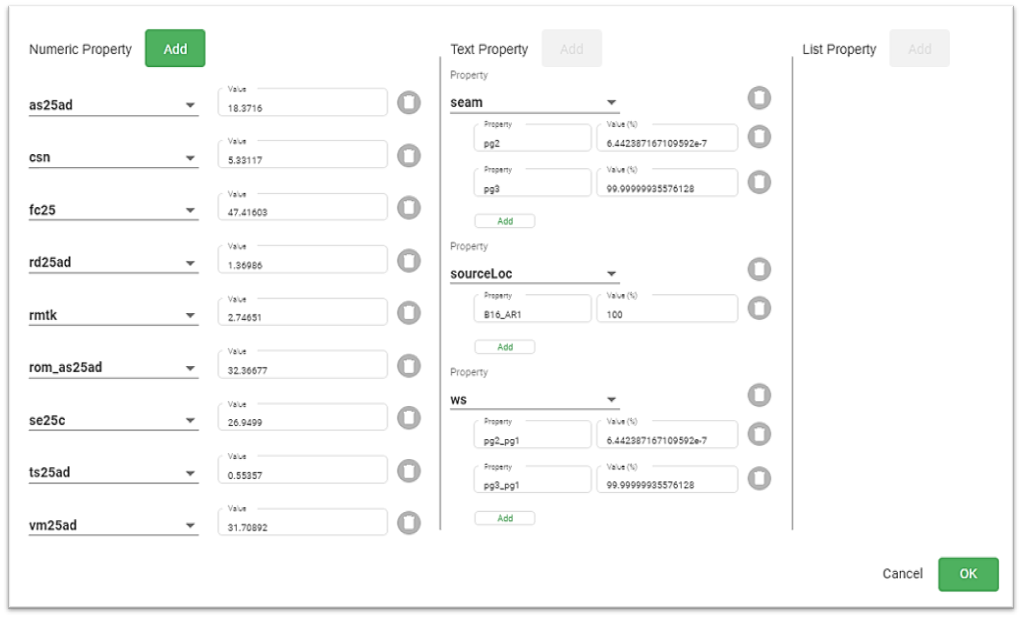
Adding Properties to your area selection
Properties can only be added if they are included in the Material Properties Schema. Refer to the above Note:
-
Click
 , a new item line is added to the property list with the next available property being listed.
-
Expand the drop-down to choose the property. Properties that are already added are greyed out.
-
In its Value field, type in a valid value.
-
Repeat the above steps until all the required properties have been included. Click
 when all properties have been added.
 Changes are updated to underlying resources in the area set by your polygons.
Altering and deleting properties
The properties editor panel allows you to modify properties that are currently listed. The following functions are available:
-
Substitute a property in the list with another by clicking its drop-down and selecting an alternate property.
-
Apply a value to a property by typing the new value into its Value field.
-
Delete a property from the list by clicking
 .
.
Moving material in a stockpile to another location
The movement of material within MaterialMRT allows you to apply a simulated real-world correction to FMS based information by relocating the required amount of material to the correct location.
In some cases, disparity between competing sources of data may occur, for example, if unregistered trips or rehandles are performed. In such cases, these materials can be moved from a location within a stockpile or grade control block and moved to other location, such as a crusher.
To move material, follow these steps:
-
Adjust your view to identify the source location of the material.
-
Click
 , the mouse pointer changes to a cross.Note
Additional help prompts are shown at the top of the viewer pane as shown below.


-
Click on the point where to move material from. A yellow line connects the selected location to the mouse pointer.
-
Click on the location where the material is to be moved to. The Movement Options dialog opens.
-
Confirm that the information is correct in the following fields:
-
Load location.
-
The Load Time. If necessary, adjust the time using the calendar picker (
 ).
). -
The Dump Location.
-
The Dump Time. If necessary, adjust the time using the calendar picker (
 ).
). -
The Payload mass. Adjust this value as needed
-
The Digger Name.
-
The Truck Name.
Make the necessary corrections then click
 . The material is moved and MaterialMRT updates the data relating to the stockpile attributes and related data (but not the FMS source itself).
Note: When the movement transaction is complete, the material is removed from the model (stockpile or grade control block) and sent to its destination. If material is sent to a non-sink zone, the material is modelled and displayed at that location. Material sent to a sink, such as a crusher, is not displayed.
-


 to centre the default location in the viewer.