Create Stereonet Contours
Stereonet contours are used to help identify discontinuity sets once a stereonet has been created. The contours represent density distributions of poles and can be set as either wireframe or flat shaded regions. You can adjust custom bandwidths of pole distribution and assign custom colours to these bandwidths. Smoothing and Terzaghi weighting are also options.
Note: Prior to creating great circles, a stereonet must be created.
-
On the Geotechnical ribbon tab navigate to the Stereonet group and select
 Stereonet contours.
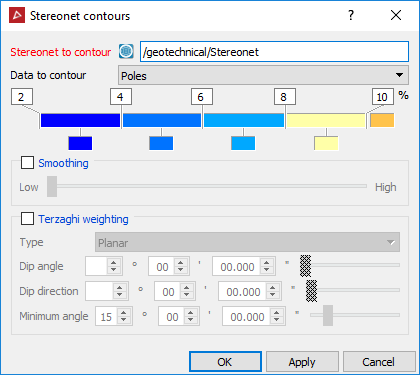
-
Drag and drop the stereonet into the Stereonet to contour field.
-
Select whether you want data to contour around poles or intersections. Select the colours and values for the percentage bandwidths to represent the data concentration by clicking on the colour swatch.
-
Check Smoothing if required.
-
Check Terzaghi weighting if required.
Terzaghi weighting uses the measurement orientation to counteract the sampling bias.
-
The Minimum angle is the lowest angle between the measurement orientation and the discontinuity that will be used for weighting.
-
Click OK or Apply to generate contours.
The contours are saved in the stereonet container.
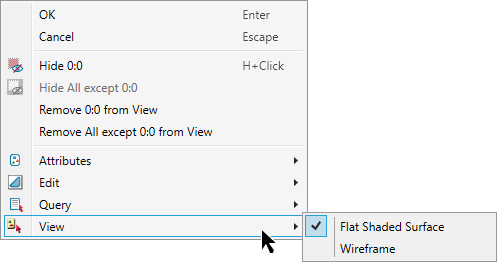
Note: Contours can be displayed as wireframe or flat
shaded. Do this from the Home ribbon tab navigate to the Colour group. From the ![]() Appearance drop-down list select either Wireframe or Flat shaded or
right-click on the object for the context menu and navigate to
Appearance drop-down list select either Wireframe or Flat shaded or
right-click on the object for the context menu and navigate to ![]() View and select a Surface Appearance type to
change the contour display mode.
View and select a Surface Appearance type to
change the contour display mode.
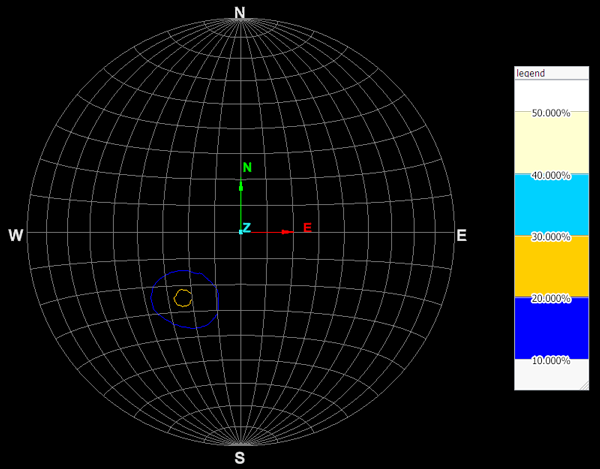
Stereonet contour (wireframe) and legend.
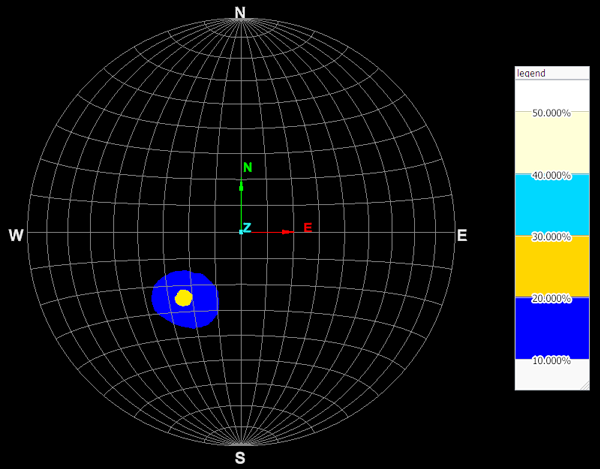
Stereonet contour (solid) and legend.