Colour Scheme
Source file: colour-scheme.htm
The Colour Scheme drop-down allows you to colour objects in various ways to make them more distinctive and easier to work with.
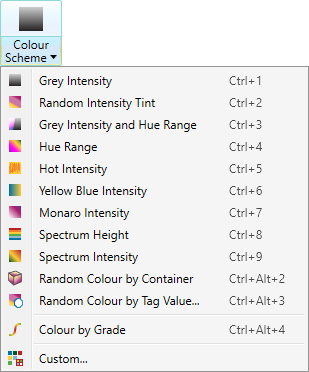
The colour schemes make use of intensity, range or height properties to colour and shade selected objects. These schemes are particularly useful for comparing objects to highlight specific features (e.g. geological features), or for presenting a more aesthetic appearance.
Note: Only scans carry intensity and range information. If a colour scheme that makes use of intensity or range is applied to an object other than a scan, the scheme will make use of height instead.
-
To apply a colour scheme:
-
Select the objects or primitives to be coloured.
-
On the Home tab, go to the Colour group. From the Colour Scheme drop-down list select one of the available schemes.

Grey Intensity: (Ctrl+1)
Apply a greyscale, based on scan intensity.

Random Intensity Tint: (Ctrl+2)
Apply a random colour, brightness determined by scan intensity.

Grey Intensity and Hue Range: (Ctrl+3)
Apply a blend of shading and colour spectrum by intensity and range, respectively.

Hue Range: (Ctrl+4)
Apply a colour spectrum by distance from the origin.

Hot Intensity: (Ctrl+5)
Colour by intensity with a heat colour scheme.

Yellow Blue Intensity: (Ctrl+6)
Colour by intensity graded yellow to blue.

Monaro Intensity: (Ctrl+7)
Colour by intensity, graded purple to white.

Spectrum Height: (Ctrl+8)
Apply a colour spectrum by height.

Spectrum Intensity: (Ctrl+9)
Apply a colour spectrum by intensity.

Random Colour by Container: (Ctrl+Alt+2)
Apply random colours to selected objects, according to their containers.

Random Colour by Tag Value: (Ctrl+Alt+3)
Colour objects based on their attribute values. Expand below for detail.

Colour by Grade: (Ctrl+Alt+4)
Colour a selected line by its inclination. Expand below for detail.
Custom:
Generate a custom colour scheme. Expand below for detail.
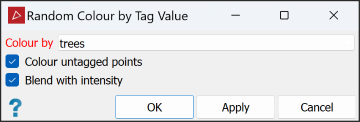
Random Colour by Tag Value... allows you to colour points differently, according to their attribute values. Each point in the selected data is coloured according to its value for the selected attribute. Untagged points may be coloured differently again.
To colour by tag value, follow these steps:
-
Select the data to be coloured in the project explorer.
-
On the Home tab, go to the Colour group. From the Colour Scheme drop-down list select
 Random Colour by Tag value....
 -
From the Colour by drop-down list select the attribute for which points are to be re-coloured. In the image above, points will be coloured according to their trees tag values.
-
Select Colour untagged points if you also want the untagged points to be coloured.
-
Select Blend with intensity to add some colour variation based on the returned signal strength.
-
Click OK or Apply.
Note: You can repeat steps 3 to 6 to colour according to a different attribute's values. However, this will overwrite the previous colouring.
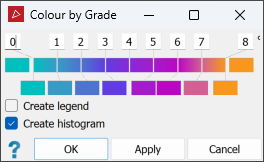
With Colour by Grade you can colour a selected line ![]() by its inclination and optionally generate a colour legend and a histogram for the selected data.
by its inclination and optionally generate a colour legend and a histogram for the selected data.
-
On the Home tab, go to the Colour group. From the Colour Scheme drop-down list select
 Colour by Grade.
 -
Select the line to be coloured. The available options are displayed by clicking on the colour.
-
Adjust the colour scale as required. See Modifying a colour scale for detailed instructions.
-
Select Create legend to make a legend indicating the colour scale. Double-click on the legend in the project explorer to view it.
-
Select Create histogram to make a graph displaying the distribution of data in front of and behind the surface. The chart will be placed in a secondary container called
colour by distance from objects legend. Double-click on the container to view the chart. -
Click OK or Apply.
Use custom colouring to apply a colour scheme to an object based on intensity, range or height properties. This option can reproduce or reverse any of the existing colour schemes, or limit them to specific values.
-
On the Home tab, go to the Colour group. From the Colour Scheme drop-down list, select
 Custom....
 -
Select the data to be coloured.
-
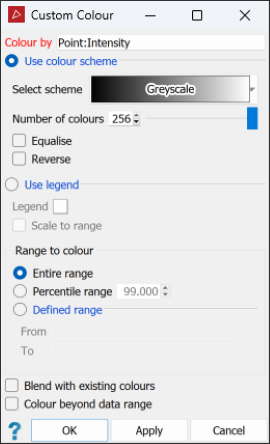
Select the required option from the Colour by drop-down list. Options available depend on the selected data.
-
Select either Use colour scheme or Use legend. Expand below for further instructions on each option.
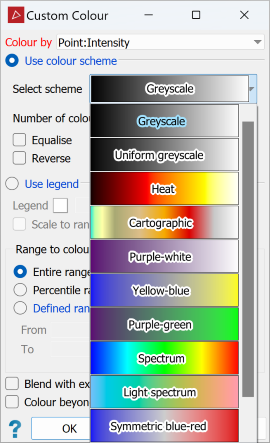
 Use colour scheme
-
Select the object or data to be coloured.
-
Select a colour scheme from the Select scheme drop-down list.
- Enter the Number of colours to determine how many colour graduations are used in the scheme.
-
Select or clear the remaining options:
- Equalise applies an equal number of all colours, improving the colour distribution.
- Reverse reverses the colour scheme.
Note: The above options are not available for all predefined colour schemes.
 Use legend
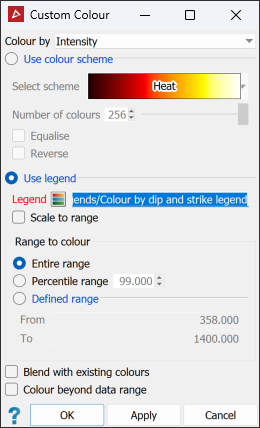
Use a colour scheme that you created in the numeric legend editor. The legend will have a relationship between its values and colour distribution.
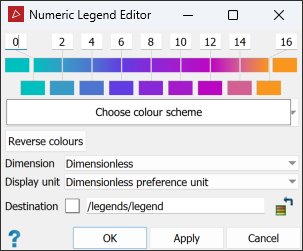

Legends are found in the
legendscontainer.-
Enter the name of the legend or drag the legend from the
legendscontainer. -
Select the objects to be coloured.
-
Select Scale to range to scale the legend to the range of data to be coloured. A new legend will be created on completion.
-
-
Select one of the following Range to colour options:
- Entire range to colour all data.
- Percentile range, then enter the percentile limit value.
- Defined range, then enter the From and To values.
-
Select or clear the remaining options per requirements:
- Blend with existing colours to blend the custom colour scheme with the existing colours.
- Colour beyond data range to extend the upper and lower limits of the colour scheme, covering the whole objects.
-
Click OK or Apply.
Note: Only visible points are coloured. If a scan has been filtered, the invisible points will remain unchanged.
Tip: You can colour different areas of the scan using different colour schemes.
