Alarms and EventsSource file: events.htm |
Whenever predefined alarm criteria are met, Sentry triggers events to notify users of situations that may require attention. Alarms and events are defined as follows:
-
Alarm: A predefined set of thresholds and conditions that, when met, trigger an event to indicate a situation requiring attention.
-
Event: A notification triggered when the conditions of an alarm are met, signalling that an attention-requiring situation has occurred.
Sentry uses the following two categories of alarms:
-
Monitoring alarms trigger monitoring events to indicate movement or weather arising in a scene, per user-specified criteria.
-
System alarms trigger system events to indicate issues arising with the Sentry system operation, hardware, and accessories.
See Event Troubleshooting Codes for details on event codes and resolving underlying issues.
Defining monitoring alarms
Alarms define certain thresholds and conditions that must be met to trigger events indicating unwanted circumstances. For example, an alarm may be triggered by cells moving more than 30 mm towards the scanner, which may have increased probability of eventual collapse. When a cell meets this condition, an event will be triggered.
-
To edit alarms, on the Home ribbon tab, in the Scene group, click
 Edit Alarms.
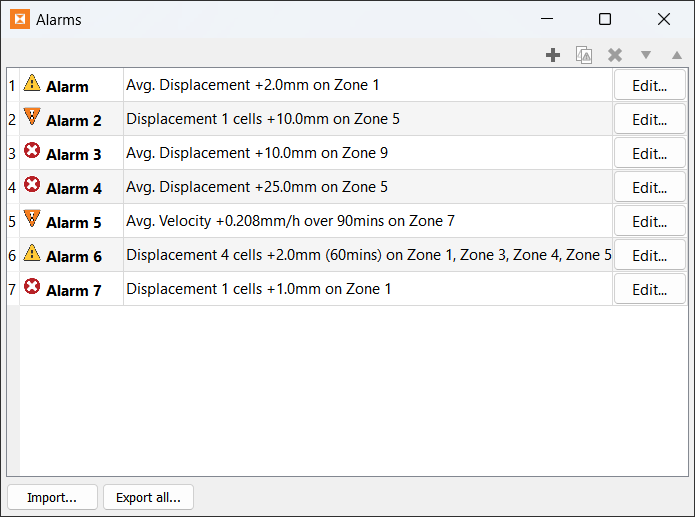
The Alarms panel has the following controls:
|
|
Open the New Alarm panel. |
|
|
Clone a selected alarm. This opens the New Alarm panel with settings copied from the selected alarm. |
|
|
Permanently delete all selected alarms. |
|
|
Move alarms up or down the list to sort them for ease of viewing. |
|
Edit... |
Modify an existing alarm. |
|
Import... |
Add alarms from other projects with the same conditions. |
|
Export all... |
Save alarm configurations to a JSON file ( |

-
All conditions of an alarm must be met for an alarm to trigger an event.
-
For a distance, velocity, or inverse velocity condition to be met, any zone within it must trigger the set parameters.
Creating and configuring monitoring alarms
Follow the instructions below to create and configure new monitoring alarms.
-
Edit Alarms
 button. This will open the New Alarm panel for editing, as shown below.
-
Select a priority from the Alert level drop-down, as defined below.
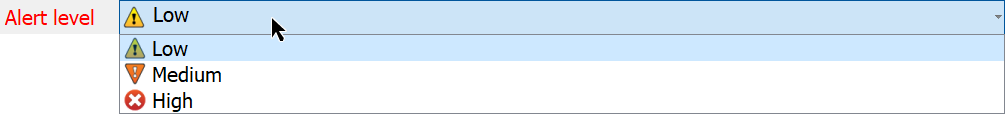

High
A system or scene failure is imminent or has occurred. Immediate corrective action is required.

Medium
An event that might lead to an interruption. Prompt corrective action is recommended.

Low
An event that will not interrupt operation. Notification is for information only; corrective action is not urgent.
-
Add conditions to the alarm as follows:
-
Click the
button on the far right of the window to open the Condition page. -
Select either Zone or Weather from the Condition type drop-down.
Available options will depend on the condition type chosen.
-
Configure the condition options per the condition type, as described below.
-
-
Click OK to add the new alarm, or click Cancel to exit without adding it.
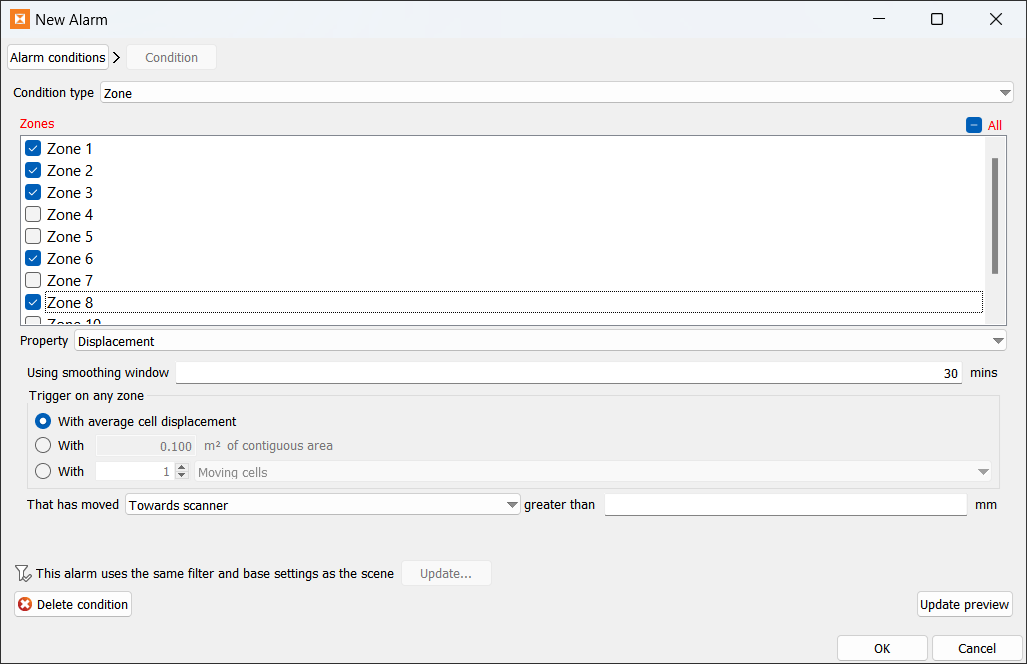
Configuring Zone condition type
Configure zone monitoring conditions as follows:
-
The Zones box lists all user-defined zones in the scene. Select the zones to be monitored by the new alarm.
-
Select the measurement to be monitored from the Property drop-down. Choose from Displacement, Velocity, and Inverse Velocity.
-
Set the remaining options according to the property selection:
Displacement
-
Using smoothing window: Enter the time window duration for averaging results.
-
Trigger on any zone: Select the appropriate option and configure the criteria accordingly.
-
That has moved: Select the direction of movement to be monitored, and enter a minimum displacement in the greater than field.
Velocity
-
Calculated over: Enter the period over which velocity is to be calculated.
-
Using smoothing window: Enter the time window duration for averaging results.
-
Trigger on any zone: Select the appropriate option and configure the criteria accordingly.
-
That is moving: Select the direction of movement to be monitored, and enter a minimum velocity in the greater than field.
Inverse Velocity
-
Calculated over: Enter the period over which velocity is to be calculated.
-
Fitting window: Enter the time period over which the line-of-best-fit is determined.
Note: Inverse velocity alarms never use smoothing, but are always based on line-fitting, regardless of the setting in Preferences > Graph.
-
Fitted line intersects with time axis within: Enter a time period within which the line-of-best-fit intersecting the time axis triggers the alarm. The time to intersection is when a structural failure may occur.
-
Configuring Weather condition type
Configure weather monitoring conditions as follows:
-
Select the measurement to be monitored from the Property drop-down. Choose between Wind speed and Precipitation.
-
Set the remaining options according to the property selection:
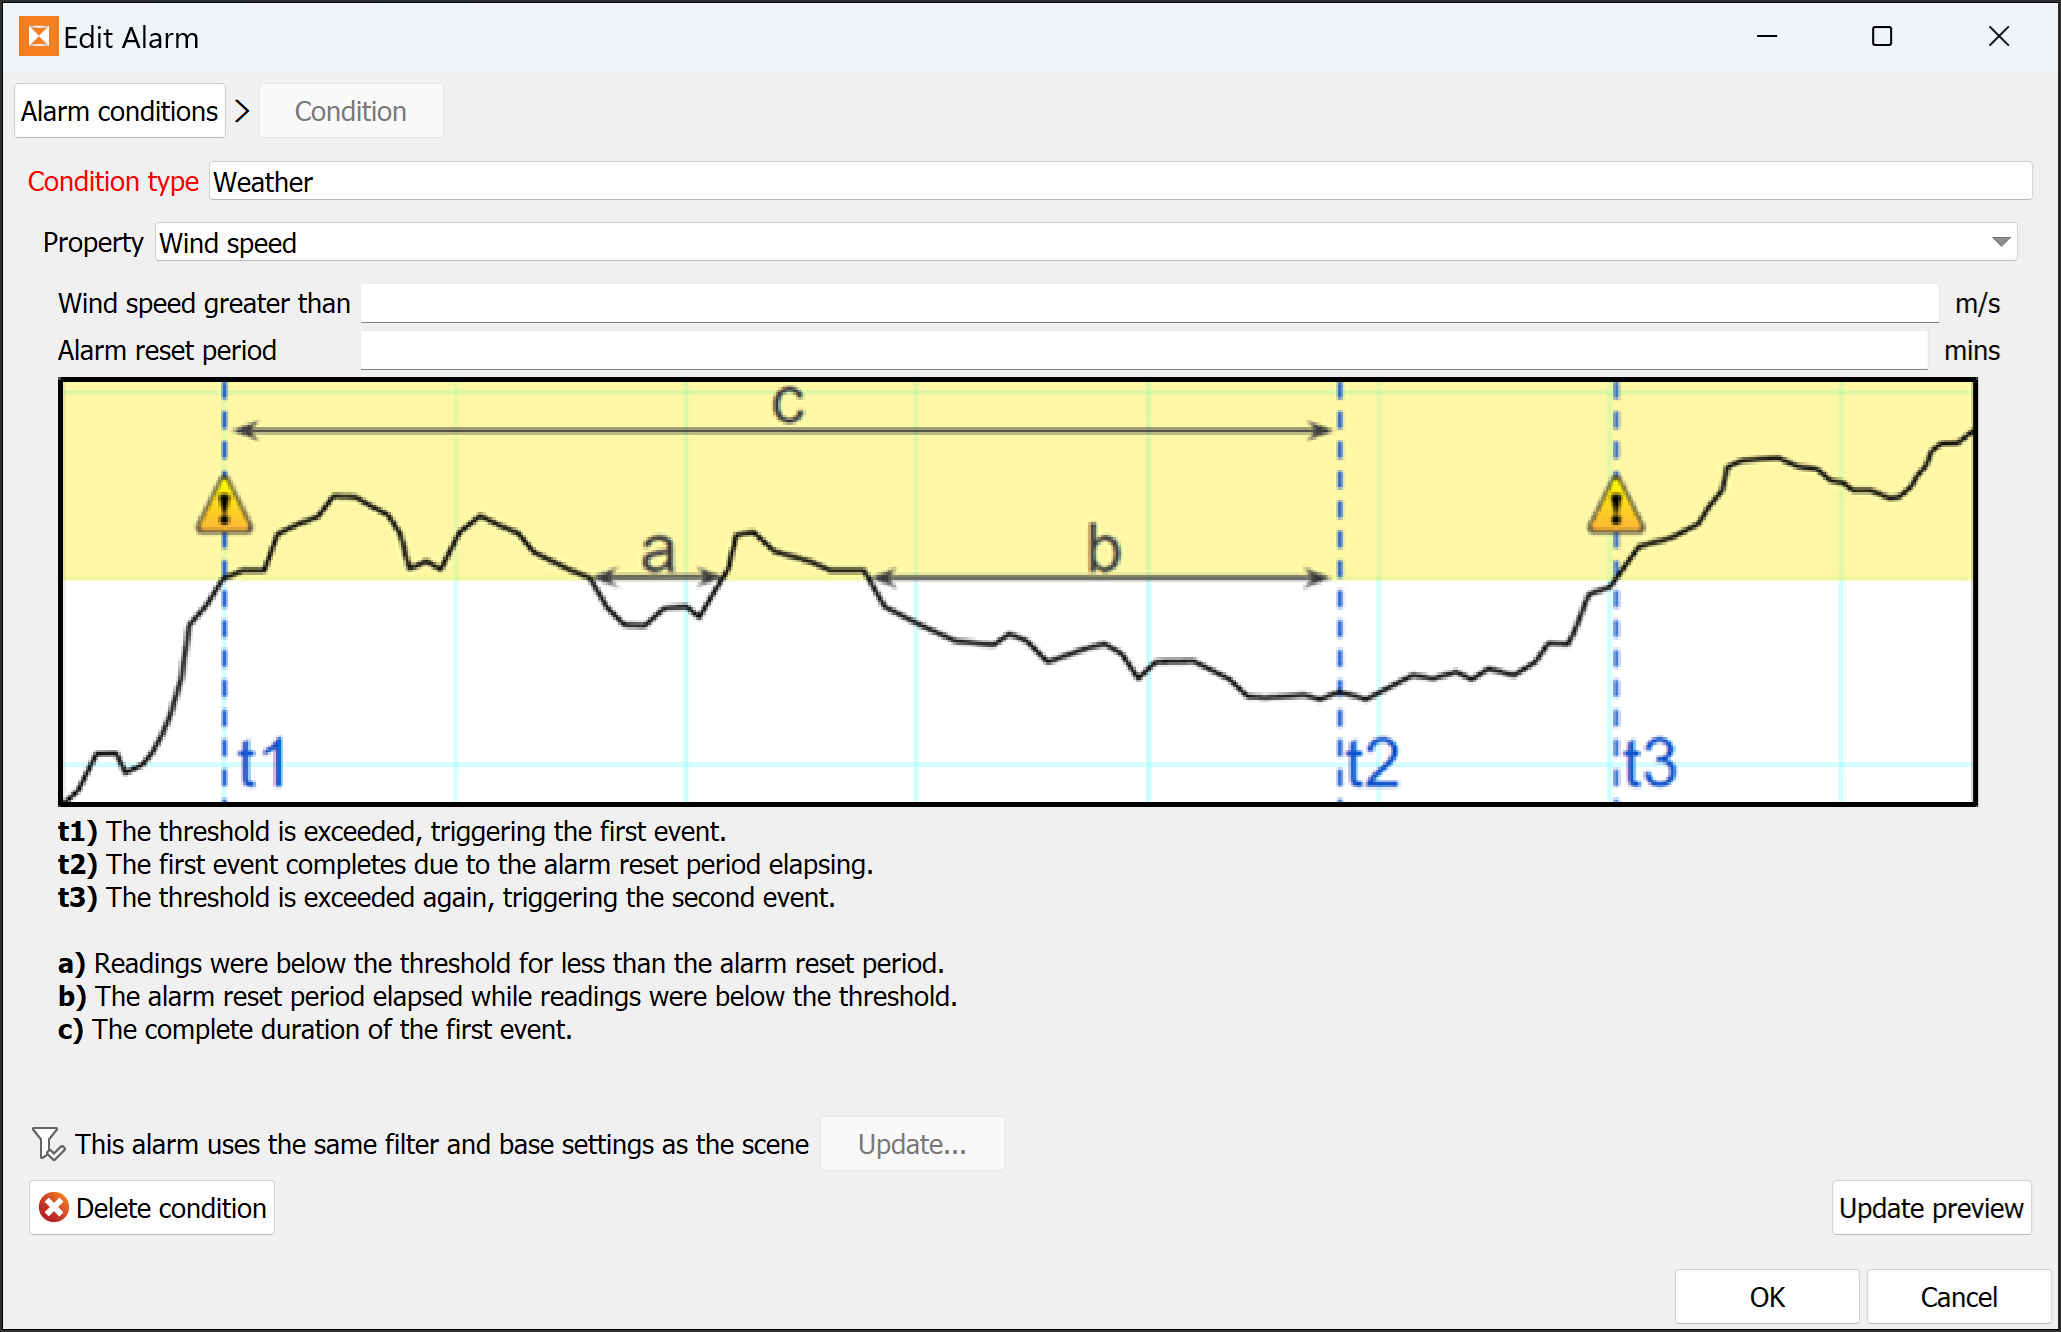
Wind speed
-
Wind speed greater than: Set the wind speed alarm threshold.
-
Alarm reset period: Specify the elapsed time required after wind speed falls below the threshold before the alarm resets.
Precipitation
-
Rain intensity greater than: Set the rain intensity alarm threshold.
-
Alarm reset period: Specify the elapsed time required after rain intensity falls below the threshold before the alarm resets.
-
Alert panel
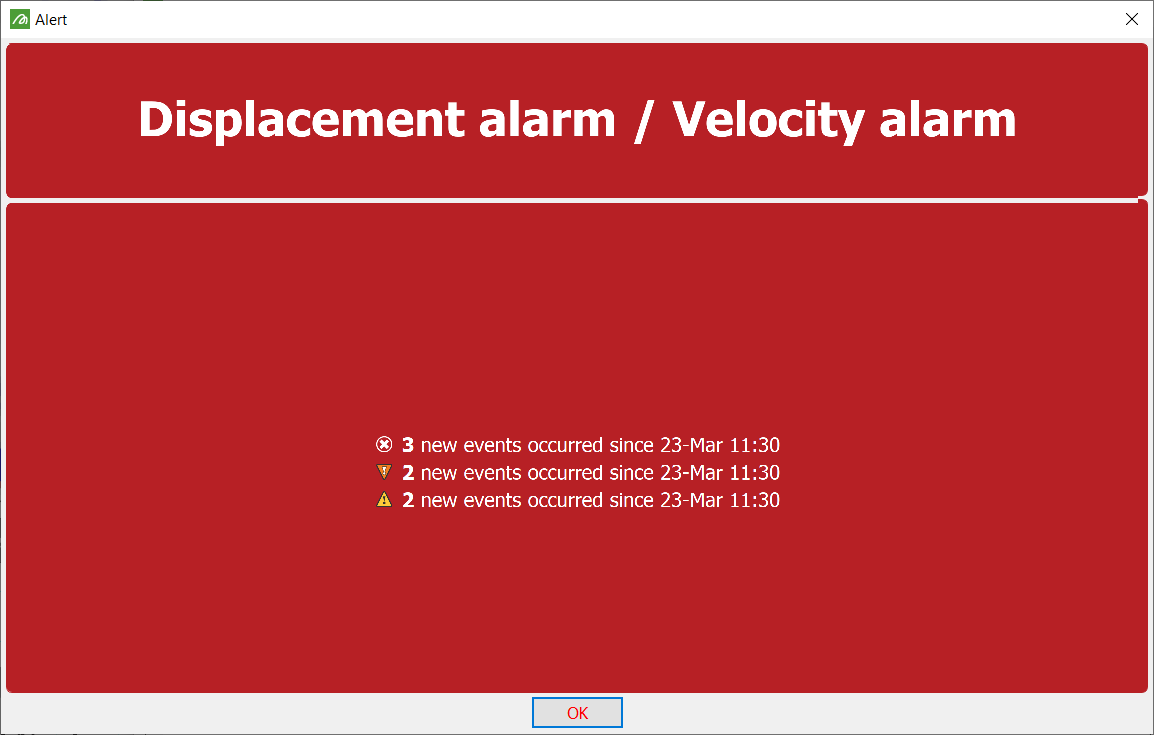
When an event is announced, a large flashing Alert panel will be displayed. This panel will display some basic information about the alarm, the number of events triggered, the types of events and when they were triggered. An audible alarm tone will also sound.
|
|
|
Example of an Alert panel |
Events are coloured according to their priority levels:
-
Yellow/White for low priority events.
-
Orange for medium priority events.
-
Red for high priority events.
Event list
The event list, to the left of the dashboard graph viewer, under the scene view, displays all system and monitoring events. You can read and interact with events as follows:
-
System events are labelled E-xx, where xx = a number associated with the event description. See Event Troubleshooting Codes for details on event codes.
-
Event counts are displayed below the event list. Counts are grouped by priority level.
-
Click on a system event to display information about that event and to shift the time slider (red line) to the time the event occurred, or the acquisition time of the scan just prior.
-
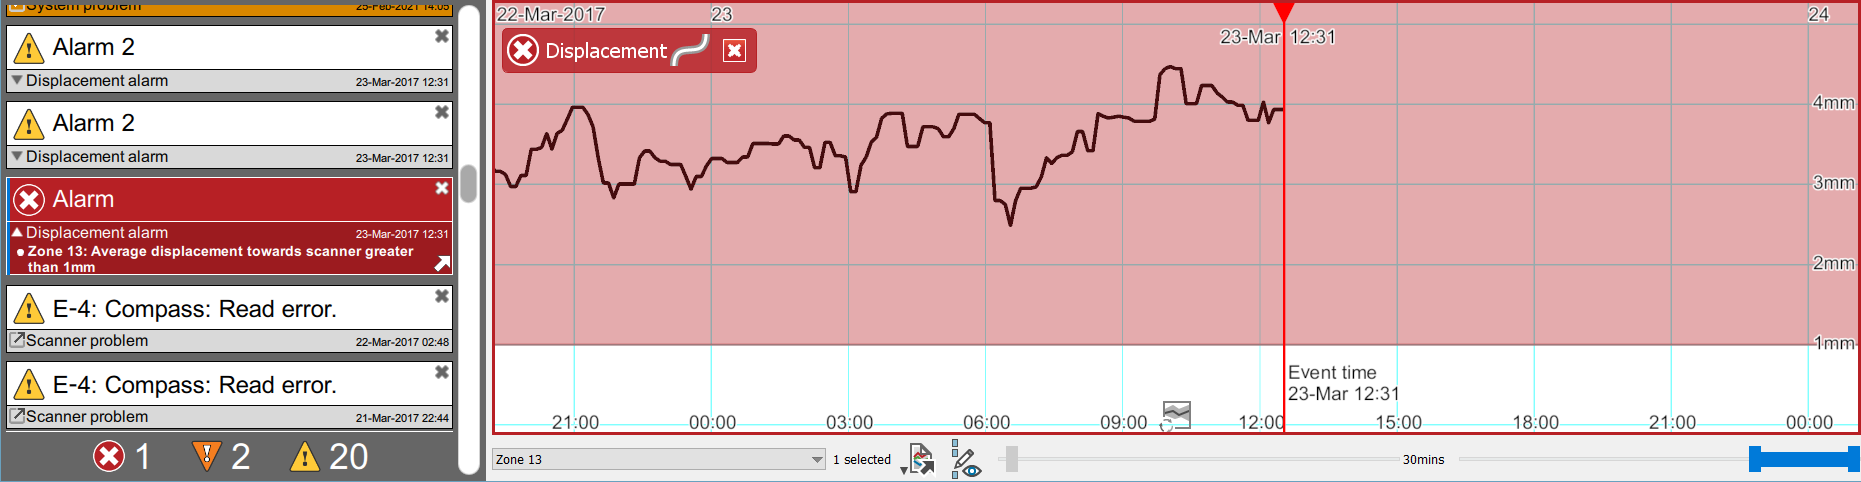
Click on an alarm-triggered event to open Event mode, revealing the conditions that initiated the event. The graph and scene views will change to show the event at the most recent time associated with that event. In Event mode, the views will have the following characteristics:
-
The scene view will have a translucent banner, coloured for the alert level, to indicate an event is in view.
-
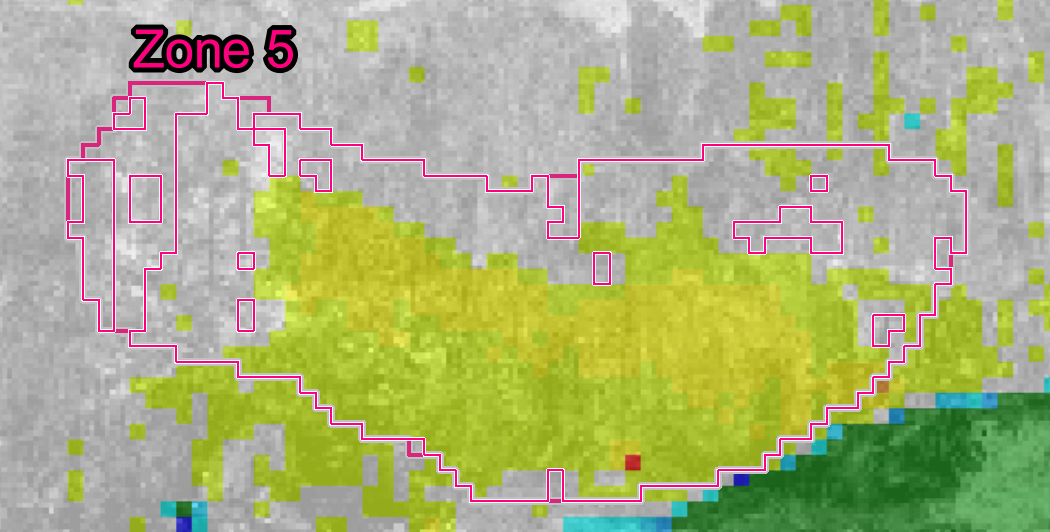
In the scene view, with cell movement conditions, the specific cells within the affected zone will be highlighted in the colour of that zone. The graph displayed will be of the affected cells only, not the full zone.
-
The graph view will have a border colour corresponding to the alert level.
-
The area of the graph that is outside the measurement thresholds, which were defined in the alarm configuration, will be overlaid with a translucent mask, coloured for the alert level.
-
While an alarm is selected, only the affected zones are shown in the zone selector list. No other zones are available for selection.
-
-
Note
If you click
 Filters and Base
-
If there are multiple conditions, you can select each condition to show the corresponding graph.
-
Click on the
 or
or  button in the bottom right corner of the alarm to generate an event report as a PDF document (
.pdf).
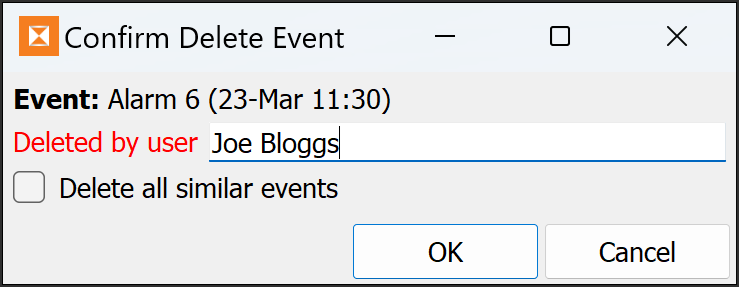
To delete an event:
-
Click the
 or
or  button in the top right corner of the event message.
 -
Enter your name.
-
Select Delete all similar events if you want to clear all other similar events in this one process.
-
Click OK to proceed.
Tip: Click on an open event in the event list to exit Event mode.
|
|
|
Cells causing the event are highlighted with borders coloured according to the corresponding zone. |