Legend Editor
Use Legend Editor to create colour legends that can be used to customise the display of certain types of data. Colour legends can be created from scratch or through modifying copies of existing legends.
Instructions
On the Analyse menu, click Legend Editor.
Note: The Legend Editor can also be accessed from the Workbench Start Page under the Tools section, or by right-clicking on an existing colour scheme file (.scd) in the Specification folder of Vulcan Explorer and selecting Open with Legend Editor from the context menu.
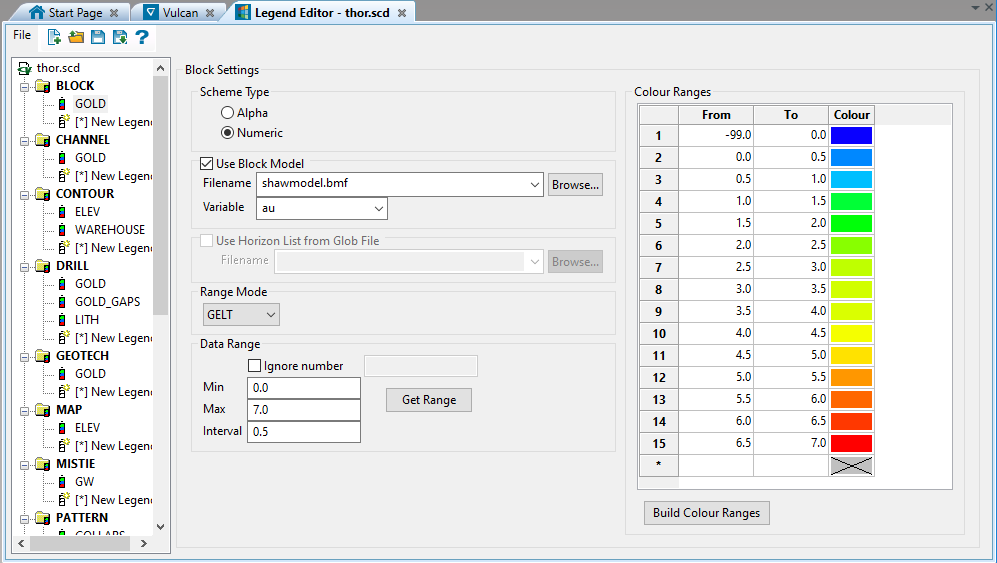
The Legend Editor will open as a tabbed window in Workbench.
Tip: Like all tabs, the Legend Editor tab can be removed from the Workbench frame by clicking and dragging to be displayed as a separate window.
Use the following toolbar icons to perform actions in the Legend Editor.
|
|
New colour legend file (.scd). |
|
|
Open a colour legend file. |
|
|
Add another colour legend file to the editor. |
|
|
Save the current colour legend file. |
|
|
Save the current colour legend file under a different name. |
|
|
Open Help documentation. |
To copy an existing colour legend, click and hold on the legend name and drag it to another position in the legend list. To copy a legend from one colour legend file to another, first click the ![]() button to open the other scheme file of interest. Then, copy legends as you normally would, clicking and dragging a legend name between the loaded colour legend files to a desired position in the legend list.
button to open the other scheme file of interest. Then, copy legends as you normally would, clicking and dragging a legend name between the loaded colour legend files to a desired position in the legend list.
Colour Scheme Types
The colour legends displayed below the Legend Editor toolbar are grouped according to colour schemes. The following colour schemes can be used in Vulcan:
|
Colour Schemes |
Used with |
Value Type |
|---|---|---|
|
Block |
Block model and microseismic data. |
Alpha or Numeric |
|
Channel |
Channel sample data. |
Alpha or Numeric |
|
Contour |
Contour and grid model data, also Chronos reserves and schedule display. |
Numeric |
|
Drill |
Drillhole and composite data. |
Alpha or Numeric |
|
Geotech |
Geotechnical data. |
Alpha or Numeric |
|
Map |
Data in mapfiles. |
Numeric |
|
Mistie |
Reservoir data. |
Numeric |
|
Pattern |
Grade control data (to associate a pattern and/or colour with a data range), downhole geophysics (to colour geophysical traces), and collar symbols on drillhole data. |
Alpha or Numeric |
|
Samples |
Sample (assay) data. |
Alpha or Numeric |
|
Scale |
Drillhole data. |
Alpha or Numeric |
|
Seismic |
Seismic data. |
Alpha |
|
Shape |
Database field data. |
Alpha or Numeric |
|
Strata |
Stratigraphic model data. |
Alpha |
|
Texture |
Triangulations and grids. |
Numeric |
A legend may exist in several colour schemes; for example, CU (copper) and AU (gold) legends for block modelling work and CU and AU legends for drilling work. The legends could also represent a seam or orebody where geology is represented by numbers.
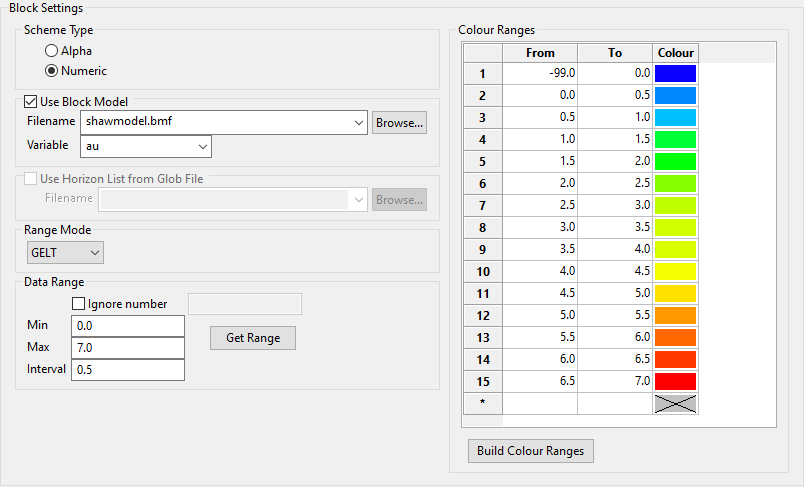
Use this legend to colour block model and microseismic data.
Follow these steps:
-
Select either Alpha or Numeric colour scheme type.
-
Enable the option Use Block Model if you want to use the values stored in a block model variable as the data range for the colour legend.
Note: This option only uses the values stored in the selected variable as a basis for the Min and Max values. The actual block model itself is not linked to the colour legend. Therefore, you can use the resulting colour legend with any block model.
-
Select Use Horizon List from Glob File to use the values stored in a (
.glob) file. This option is only available if Alpha scheme type has been selected. -
Select a Range Mode from the drop-down list. This controls how the range will interpret the end values of each interval.
Range Description Min ≤ X < Max GELT - Greater than or equal to the minimum value and less than that maximum value. Min < X ≤ Max GTLE - Greater than the minimum value and less than or equal to the maximum value. Min < X < Max GTLT - Greater than the minimum value and less than the maximum value. Min ≤ X ≤ Max GELE - Greater than or equal to the minimum value and less than or equal to the maximum value. -
Set the Data Range by entering a Min and Max value, then an Interval for each step.
You can ignore a number by enabling Ignore number, then entering the number in the space provided.
Example: Ignore the default number representing unestimated blocks in a block model, for example
-99.0.Note: If you are using a block model variable, you can click the Get Range button to automatically fill the Min and Max values of the data range. You can then adjust those values if needed.
-
Click the Build Colour Ranges button to populate the Colour Ranges table from the Data Range inputs. If Alpha scheme type has been selected, you can sort the colour range values using the Sort Ascending and Sort Descending buttons.
Note: Alternatively, if you do not want to use evenly spaced intervals, you can enter the From and To ranges manually without using the Data Range inputs. If you decide to enter the ranges manually, you will not need to click the Build Colour Ranges button.
-
Select a colour for each range/value in the Colour Ranges table. To set colours automatically, right-click on the Colour column header, select Colour Range from the context menu, and choose the start colour and, optionally, the end colour from the palette to generate a range of colours in the table. To set colours individually, double-click the Colour field by each range/value and select from the palette.
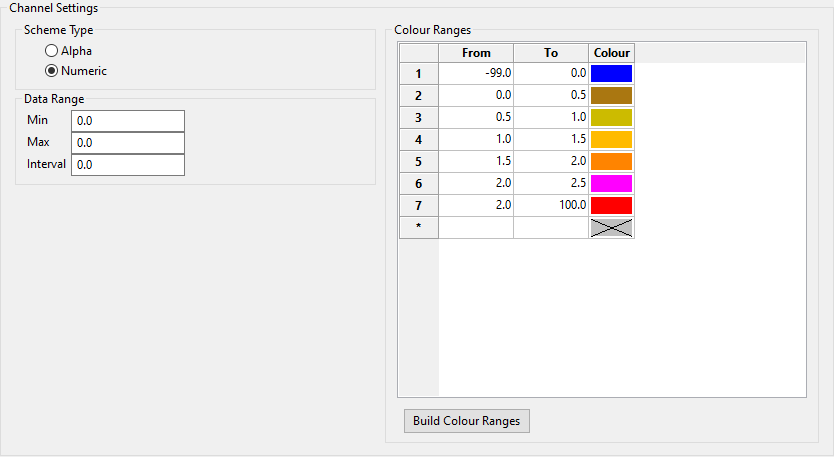
Use this type of legend when displaying channel sample data.
Follow these steps:
-
Select either Alpha or Numeric colour scheme type.
-
Set the Data Range by entering a Min and Max value, then an Interval for each step.
-
Click the Build Colour Ranges button to populate the Colour Ranges table from the Data Range inputs. If Alpha scheme type has been selected, you can sort the colour range values using the Sort Ascending and Sort Descending buttons.
Note: Alternatively, if you do not want to use evenly spaced intervals, you can enter the From and To ranges manually without using the Data Range inputs. If you decide to enter the ranges manually, you will not need to click the Build Colour Ranges button.
-
Select a colour for each range/value in the Colour Ranges table. To create a colour spectrum automatically, right-click on the Colour column header, select Colour Range from the context menu, and choose the start colour and, optionally, the end colour from the palette to generate a range of colours in the table. To set colours individually, double-click the Colour field by each range/value and select from the palette.
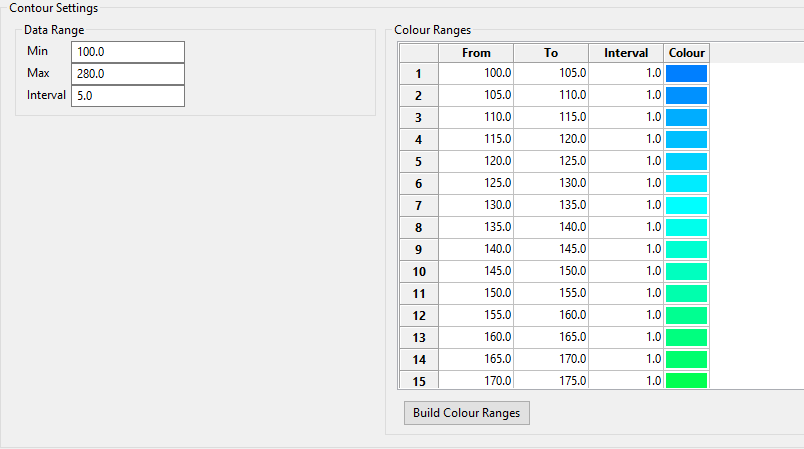
Use this legend when displaying contour or grid model data, also Chronos reserves and schedule display. You can also create a contour layer using the settings entered here. (See Model > Contouring > Contour.)
Follow these steps:
-
Set the Data Range by entering a Min and Max value, then an Interval for each step.
-
Click the Build Colour Ranges button to populate the Colour Ranges table from the Data Range inputs.
Note: Alternatively, if you do not want to use evenly spaced intervals, you can enter the From and To ranges manually without using the Data Range inputs. If you decide to enter the ranges manually, you will not need to click the Build Colour Ranges button.
-
Set the minor interval distance using the Interval column.
Note: The From and To values create the major intervals. The Interval column sets the minor intervals between each major interval.
-
Select a colour for each range in the Colour Ranges table. To set colours automatically, right-click on the Colour column header, select Colour Range from the context menu, and choose the start colour and, optionally, the end colour from the palette to generate a range of colours in the table. To set colours individually, double-click the Colour field by each range and select from the palette.
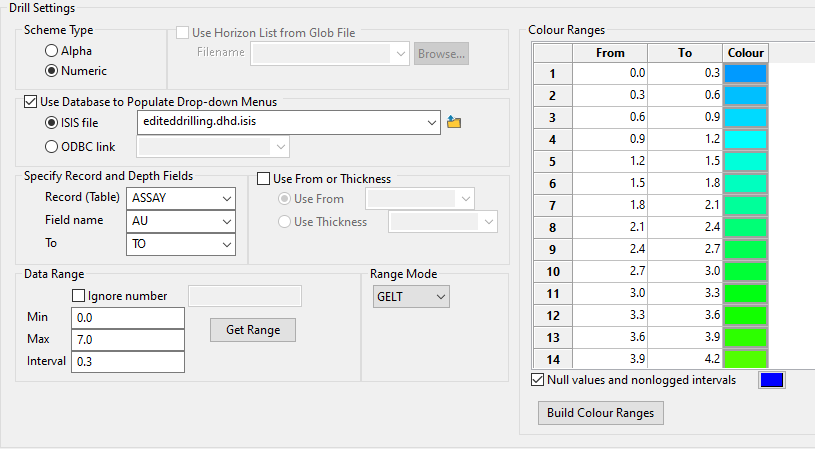
Use this legend to display drillhole and composite data.
Follow these steps:
-
Select either Alpha or Numeric colour scheme type.

-
Select Use Horizon List from Glob File to use the values stored in a (
.glob) file. This option is only available if an Alpha scheme type has been selected. -
Enable the option Use Database to Populate Drop-down Menus if you want to use the values stored in a database field. The values found in the drop-down lists for Specify Record and Depth Fields will be pulled from the selected database.
-
Enable Use From or Thickness to select a field for Use From or Use Thickness. Both measure the length of a drillhole interval.
NoteUse From measures the length by calculating the distance along the drillhole from one interval to the next.
Use Thickness pulls from the field containing the length of the interval. This is commonly used with composite databases.
-
Set the Data Range by entering a Min and Max value, then an Interval for each step.
You can ignore a number by enabling Ignore number, then entering the number in the space provided.
Example: Ignore the default number or numbers representing intervals that do not have assays, for example
-99.0.Note: If you are using a database field, you can click the Get Range button to automatically fill the Min and Max values of the data range. You can then adjust those values if needed.
-
Select a Range Mode from the drop-down list. This controls how the range will interpret the end values of each interval.
Range Description Min ≤ X < Max GELT - Greater than or equal to the minimum value and less than that maximum value. Min < X ≤ Max GTLE - Greater than the minimum value and less than or equal to the maximum value. Min < X < Max GTLT - Greater than the minimum value and less than the maximum value. Min ≤ X ≤ Max GELE - Greater than or equal to the minimum value and less than or equal to the maximum value. -
Click the Build Colour Ranges button to populate the Colour Ranges table from the Data Range inputs. If Alpha scheme type has been selected, you can sort the colour range values using the Sort Ascending and Sort Descending buttons.
Note: Alternatively, if you do not want to use evenly spaced intervals, you can enter the From and To ranges manually without using the Data Range inputs. If you decide to enter the ranges manually, you will not need to click the Build Colour Ranges button.
-
Select a colour for each range/value in the Colour Ranges table. To set colours automatically, right-click on the Colour column header, select Colour Range from the context menu, and choose the start colour and, optionally, the end colour from the palette to generate a range of colours in the table. To set colours individually, double-click the Colour field by each range/value and select from the palette.
-
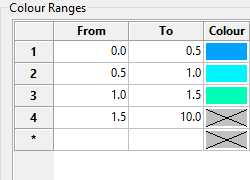
Enable the option for Null values and non-logged intervals to set a colour for these circumstances.
NoteSections that were logged but do not contain a field value that matches an entry in the legend can be treated several ways.
-
Add an asterisk (
*) as the value for alpha legends, then assign it a colour. This entry must be the last entry in the Colour Ranges table.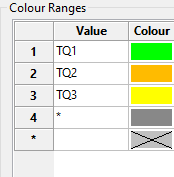
-
Enter an extreme number range for numeric legends, then assign it a colour. This entry must be the last entry in the Colour Ranges table.
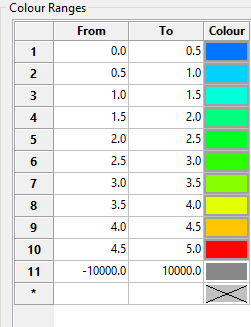
-
Leave the colour selection blank if you do not want these values to be displayed.
-
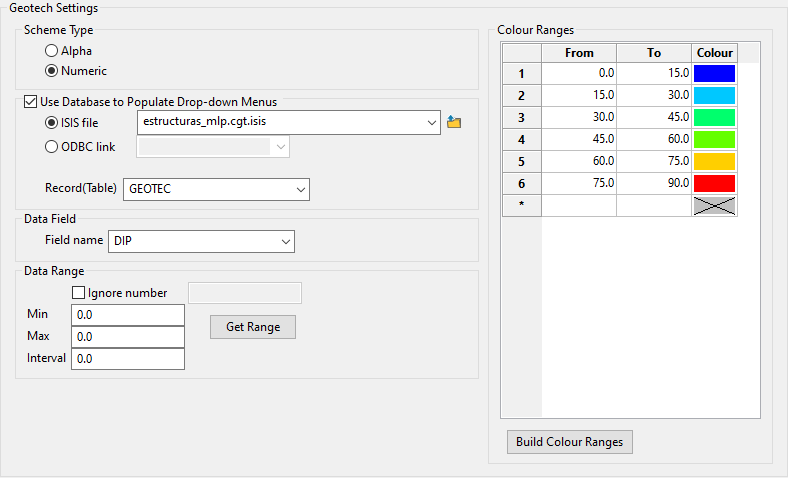
Use this legend to display geotechnical data.
Follow these steps:
-
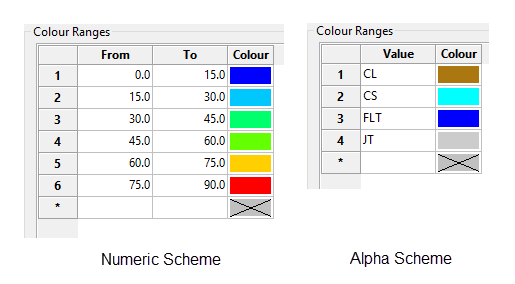
Select either Alpha or Numeric colour scheme type.
-
Enable the option Use Database to Populate Drop-down Menus if you want to use the values stored in a database field. The values found in the drop-down lists for Record (Table) and Field name will be pulled from the selected database.
-
Set the Data Range by entering a Min and Max value, then an Interval for each step.
You can ignore a number by enabling Ignore number, then entering the number in the space provided.
Example: Ignore the default number or numbers representing intervals that do not have assays, for example
-99.0.Note: If you are using a database field, you can click the Get Range button to automatically fill the Min and Max values of the Data Range. You can then adjust those values if needed.
-
Click the Build Colour Ranges button to populate the Colour Ranges table from the Data Range inputs. If Alpha scheme type has been selected, you can sort the colour range values using the Sort Ascending and Sort Descending buttons.
Note: Alternatively, if you do not want to use evenly spaced intervals, you can enter the From and To ranges manually without using the Data Range inputs. If you decide to enter the ranges manually, you will not need to click the Build Colour Ranges button.
-
Select a colour for each range/value in the Colour Ranges table. To set colours automatically, right-click on the Colour column header, select Colour Range from the context menu, and choose the start colour and, optionally, the end colour from the palette to generate a range of colours in the table. To set colours individually, double-click the Colour field by each range/value and select from the palette.
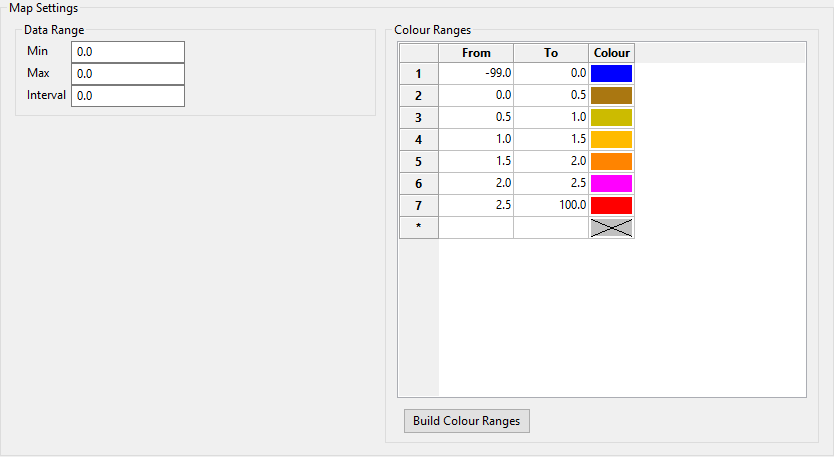
Use this legend to display data in mapfiles.
Follow these steps:
-
Set the Data Range by entering a Min and Max value, then an Interval for each step.
-
Click the Build Colour Ranges button to populate the Colour Ranges table from the Data Range inputs.
Note: Alternatively, if you do not want to use evenly spaced intervals, you can enter the From and To ranges manually without using the Data Range inputs. If you decide to enter the ranges manually, you will not need to click the Build Colour Ranges button.
-
Select a colour for each range in the Colour Ranges table. To set colours automatically, right-click on the Colour column header, select Colour Range from the context menu, and choose the start colour and, optionally, the end colour from the palette to generate a range of colours in the table. To set colours individually, double-click the Colour field by each range and select from the palette.
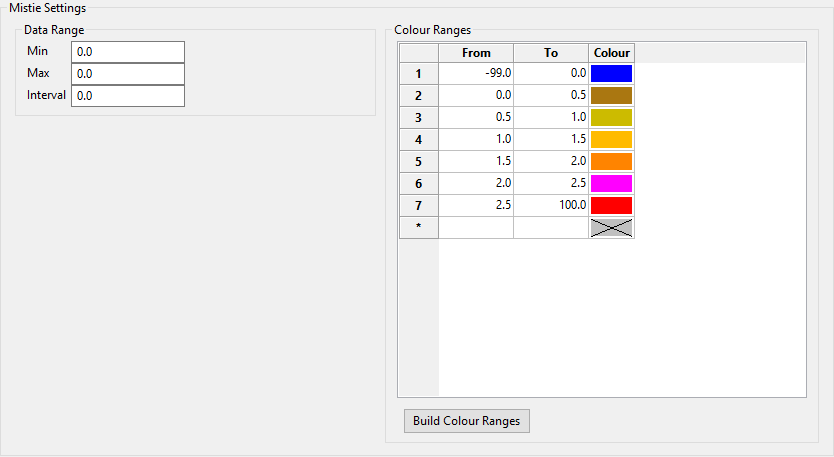
Use this legend to display reservoir data.
Follow these steps:
-
Set the Data Range by entering a Min and Max value, then an Interval for each step.
-
Click the Build Colour Ranges button to populate the Colour Ranges table from the Data Range inputs.
Note: Alternatively, if you do not want to use evenly spaced intervals, you can enter the From and To ranges manually without using the Data Range inputs. If you decide to enter the ranges manually, you will not need to click the Build Colour Ranges button.
-
Select a colour for each range in the Colour Ranges table. To set colours automatically, right-click on the Colour column header, select Colour Range from the context menu, and choose the start colour and, optionally, the end colour from the palette to generate a range of colours in the table. To set colours individually, double-click the Colour field by each range and select from the palette.
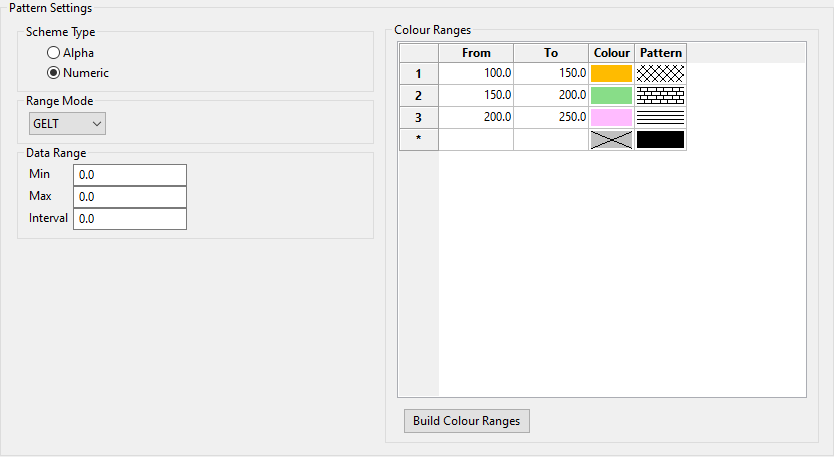
Use this legend to display grade control data (to associate a pattern and/or colour with a data range), downhole geophysics (to colour geophysical traces), or collar symbols on drillhole data.
Follow these steps:
-
Select either Alpha or Numeric colour scheme type.
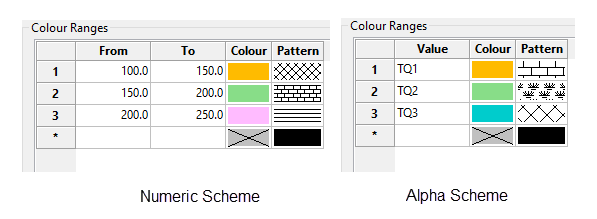
-
Select a Range Mode from the drop-down list. This controls how the range will interpret the end values of each interval.
Range Description Min ≤ X < Max GELT - Greater than or equal to the minimum value and less than that maximum value. Min < X ≤ Max GTLE - Greater than the minimum value and less than or equal to the maximum value. Min < X < Max GTLT - Greater than the minimum value and less than the maximum value. Min ≤ X ≤ Max GELE - Greater than or equal to the minimum value and less than or equal to the maximum value. -
Set the Data Range by entering a Min and Max value, then an Interval for each step.
-
Click the Build Colour Ranges button to populate the Colour Ranges table from the Data Range inputs. If Alpha scheme type has been selected, you can sort the colour range values using the Sort Ascending and Sort Descending buttons.
Note: Alternatively, if you do not want to use evenly spaced intervals, you can enter the From and To ranges manually without using the Data Range inputs. If you decide to enter the ranges manually, you will not need to click the Build Colour Ranges button.
-
Select a colour for each range/value in the Colour Ranges table. To set colours automatically, right-click on the Colour column header, select Colour Range from the context menu, and choose the start colour and, optionally, the end colour from the palette to generate a range of colours in the table. To set colours individually, double-click the Colour field by each range/value and select from the palette.
-
Double-click the Pattern field to select a fill pattern for each range/value. Pattern 1 (solid fill) is selected by default when creating a new legend.
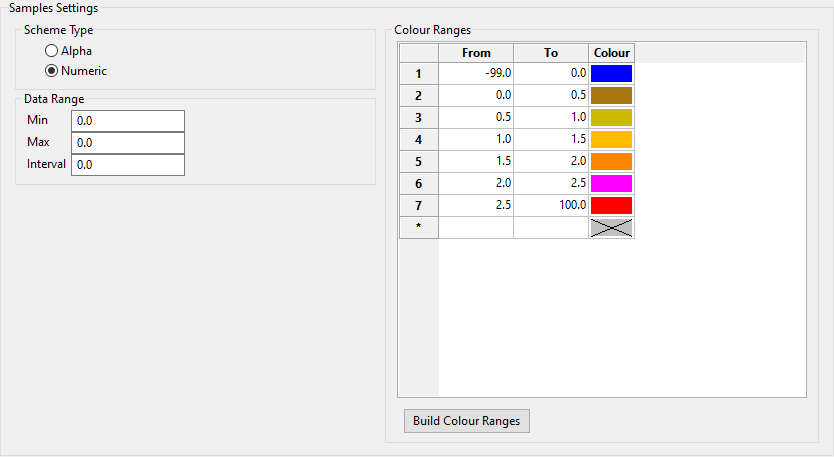
Use this legend to display sample (assay) data.
Follow these steps:
-
Select either Alpha or Numeric colour scheme type.

-
Set the Data Range by entering a Min and Max value, then an Interval for each step.
-
Click the Build Colour Ranges button to populate the Colour Ranges table from the Data Range inputs. If Alpha scheme type has been selected, you can sort the colour range values using the Sort Ascending and Sort Descending buttons.
Note: Alternatively, if you do not want to use evenly spaced intervals, you can enter the From and To ranges manually without using the Data Range inputs. If you decide to enter the ranges manually, you will not need to click the Build Colour Ranges button.
-
Select a colour for each range/value in the Colour Ranges table. To set colours automatically, right-click on the Colour column header, select Colour Range from the context menu, and choose the start colour and, optionally, the end colour from the palette to generate a range of colours in the table. To set colours individually, double-click the Colour field by each range/value and select from the palette.
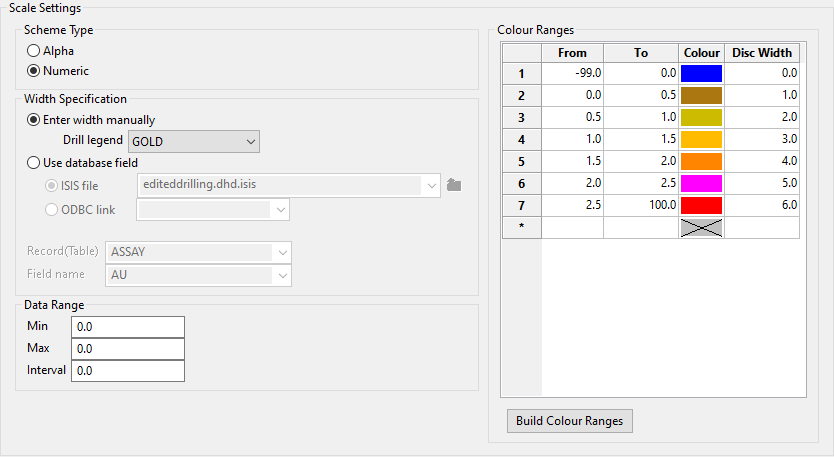
Use this legend to display drillhole data with discs.
Follow these steps:
-
Select either Alpha or Numeric colour scheme type.
-
Enter the Width Specification by choosing Enter width manually or Use database field.
Enter width manually:
-
Select the legend you want to use.
-
The selection in the Drill legend drop-down list will match whatever has been set up in the Drill legend panel of the Legend Editor.
-
If Alpha scheme type has been selected, then only alpha-type legends will be displayed in the Drill legend drop-down list. Similarly, if Numeric scheme type has been selected, then only numeric legends will be displayed in the list.
-
Set the Data Range by entering a Min and Max value, then an Interval for each step.
-
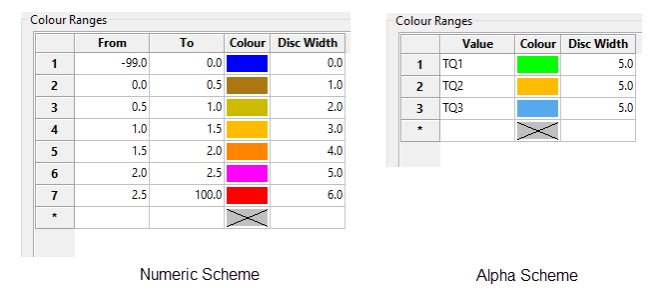
Click the Build Colour Ranges button to populate the Colour Ranges table from the Data Range inputs. If Alpha scheme type has been selected, you can sort the colour range values using the Sort Ascending and Sort Descending buttons.
Note: Alternatively, if you do not want to use evenly spaced intervals, you can enter the From and To ranges manually without using the Data Range inputs. If you decide to enter the ranges manually, you will not need to click the Build Colour Ranges button.
-
Select a colour for each range/value in the Colour Ranges table. To set colours automatically, right-click on the Colour column header, select Colour Range from the context menu, and choose the start colour and, optionally, the end colour from the palette to generate a range of colours in the table. To set colours individually, double-click the Colour field by each range/value and select from the palette.
-
Enter the width of the cylindrical disc for each range/value. The width dimension will be in the units assigned in the project file (
.dg1), which can be accessed from the Specifications folder of Vulcan Explorer.
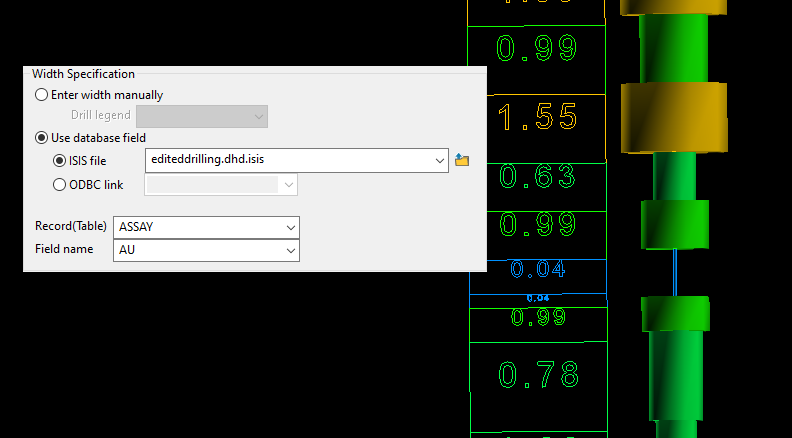
Use database field:
This option will read the width of the discs from a database field.
-
Select the ISIS file or ODBC link.
-
Select the Record (Table) and Field name from the selected database.
Since the information is being drawn from the database with this option, you do not need to do anything with the Colour Ranges table.
In this case, the disc widths were set to the value found in the assay grade of the drillhole database.
-
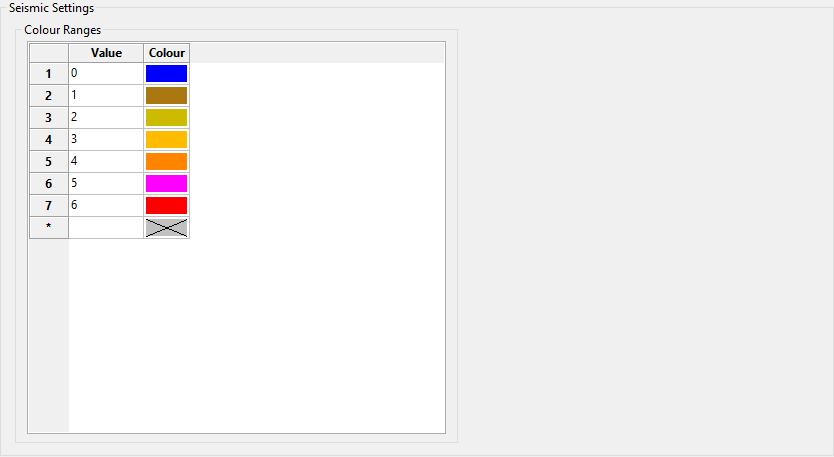
Use this legend to display seismic data.
Follow these steps:
-
Enter the string values to which the colours will be applied. Up to 100 entries can be made. Wildcard characters can be used. Use "
*" (asterisk) for multiple characters, or "%" to replace a single character. -
Select a colour for each value in the Colour Ranges table. To set colours automatically, right-click on the Colour column header, select Colour Range from the context menu, and choose the start colour and, optionally, the end colour from the palette to generate a range of colours in the table. To set colours individually, double-click the Colour field by each value and select from the palette.
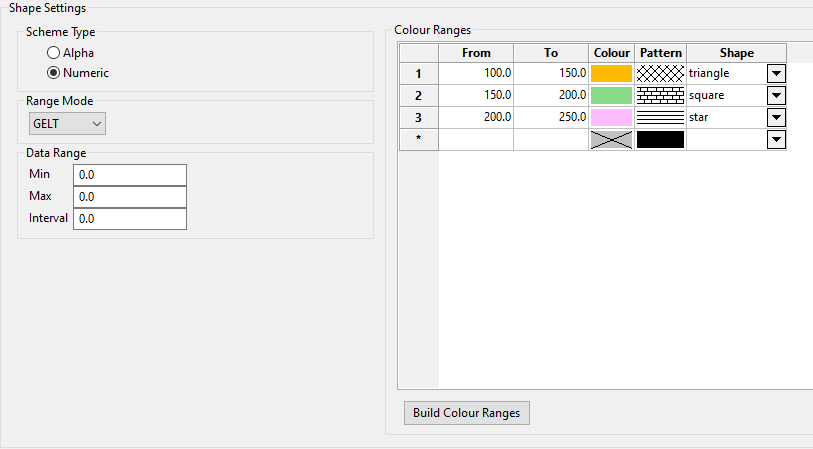
Use this legend to assign a symbol based on the value of a database field.
Follow these steps:
-
Select either Alpha or Numeric colour scheme type.

-
Select a Range Mode from the drop-down list. This controls how the range will interpret the end values of each interval.
Range Description Min ≤ X < Max GELT - Greater than or equal to the minimum value and less than that maximum value. Min < X ≤ Max GTLE - Greater than the minimum value and less than or equal to the maximum value. Min < X < Max GTLT - Greater than the minimum value and less than the maximum value. Min ≤ X ≤ Max GELE - Greater than or equal to the minimum value and less than or equal to the maximum value. -
Set the Data Range by entering a Min and Max value, then an Interval for each step.
-
Click the Build Colour Ranges button to populate the Colour Ranges table from the Data Range inputs. If Alpha scheme type has been selected, you can sort the colour range values using the Sort Ascending and Sort Descending buttons.
Note: Alternatively, if you do not want to use evenly spaced intervals, you can enter the From and To ranges manually without using the Data Range inputs. If you decide to enter the ranges manually, you will not need to click the Build Colour Ranges button.
-
Select a colour for each range/value in the Colour Ranges table. To set colours automatically, right-click on the Colour column header, select Colour Range from the context menu, and choose the start colour and, optionally, the end colour from the palette to generate a range of colours in the table. To set colours individually, double-click the Colour field by each range/value and select from the palette.
-
Double-click the Pattern field to select a fill pattern for each range/value. Pattern 1 (solid fill) is selected by default when creating a new legend.
-
Select a shape from the drop-down list for each range/value.
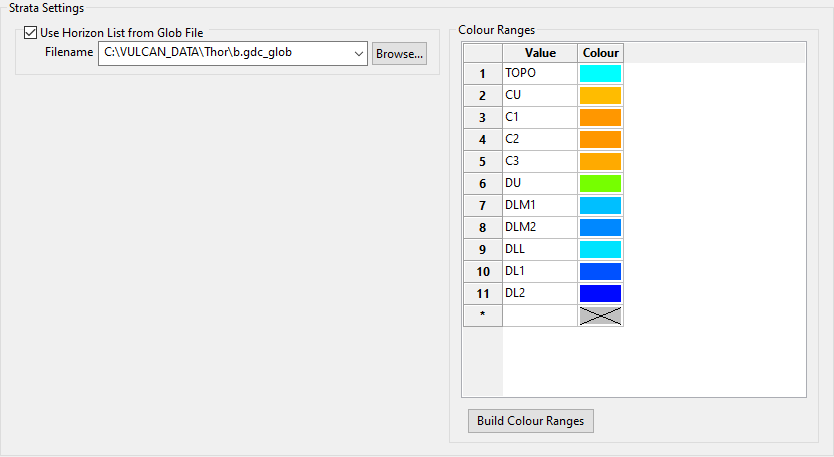
Use this legend to display stratigraphic model data.
Follow these steps:
-
Select Use Horizon List from Glob File to use the values stored in a (
.glob) file, then click the Build Colour Ranges button to populate the table. -
Alternatively, you can enter the string values manually in the Colour Ranges table. Up to 100 entries can be made. Wildcard characters can be used. Use "
*" (asterisk) for multiple characters, or "%" to replace a single character. -
Select a colour for each value in the Colour Ranges table. To set colours automatically, right-click on the Colour column header, select Colour Range from the context menu, and choose the start colour and, optionally, the end colour from the palette to generate a range of colours in the table. To set colours individually, double-click the Colour field by each value and select from the palette.
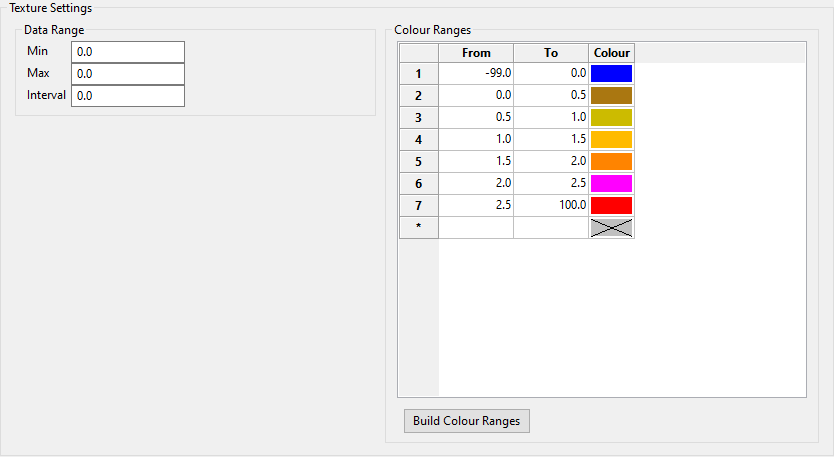
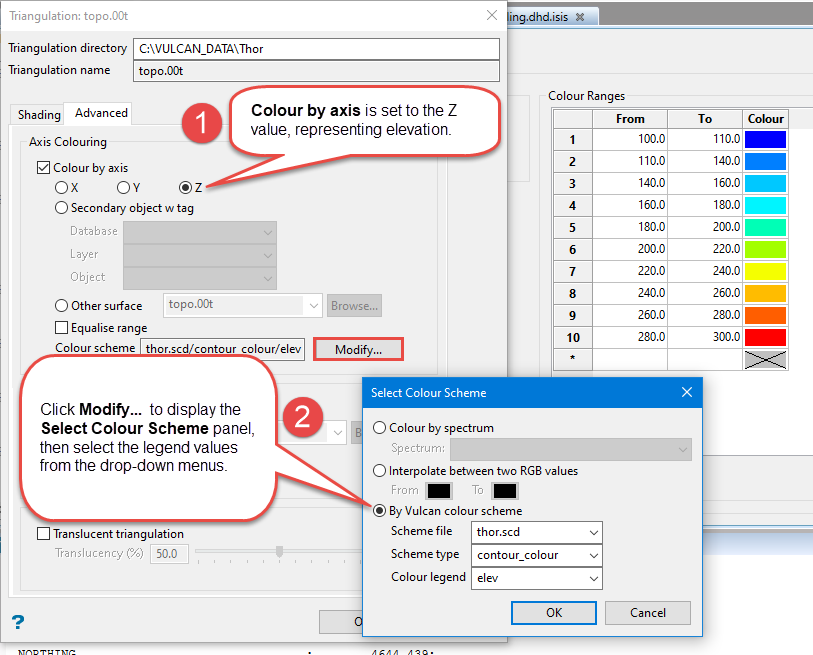
Use this legend to colour triangulations or grids.
Follow these steps:
-
Set the Data Range by entering a Min and Max value, then an Interval for each step.
-
Click the Build Colour Ranges button to populate the Colour Ranges table from the Data Range inputs.
Note: Alternatively, if you do not want to use evenly spaced intervals, you can enter the From and To ranges manually without using the Data Range inputs. If you decide to enter the ranges manually, you will not need to click the Build Colour Ranges button.
-
Select a colour for each range in the Colour Ranges table. To set colours automatically, right-click on the Colour column header, select Colour Range from the context menu, and choose the start colour and, optionally, the end colour from the palette to generate a range of colours in the table. To set colours individually, double-click the Colour field by each range and select from the palette.
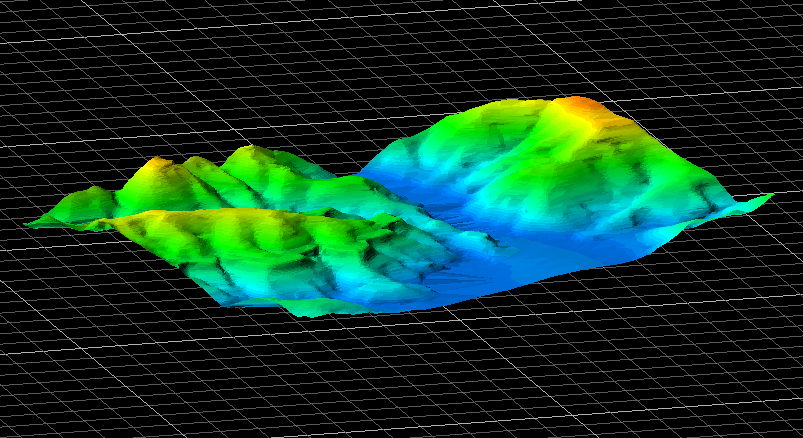
After setting up the Texture legend, this topographic surface triangulation was loaded into Vulcan. By right-clicking on the triangulation, then selecting Properties, the following settings were applied.
Tips for setting the colour
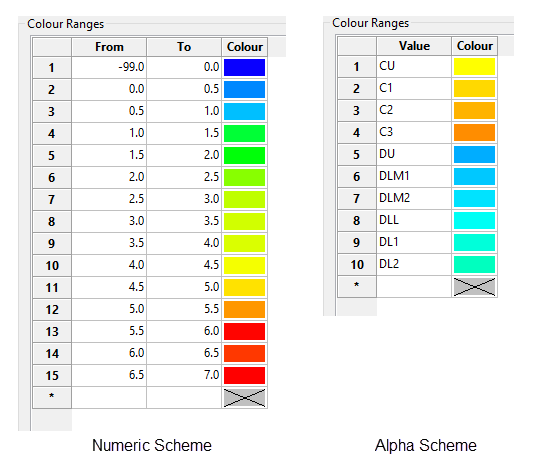
Colour legends are read by the system from top to bottom and the first condition that matches the value will be used. This means that if you have the same value assigned to two different colours, as in the example below, the top colour would be used. In this case, red would be assigned.

Figure 1 : Two colours assigned to one value.
Colour 1 of the current colour table will be used for field values not matching any entry in the legend. To use another colour, make an entry with the value "*" (asterisk) and assign it a colour. This entry must be in the last row of the Colour Ranges table of the legend.
Objects in a range using the "no colour" setting, that is, the X in the diagram above, will be coloured black. We recommend that you delete these entries from the colour legend.
Setting colours sequentially
To set the colours for ranges/values sequentially, that is, in the same order as they appear in the Colour Ranges table, right-click on the Colour column header and select Colour Range from the displayed context menu. You must then select the colour from which you want to start the sequence. This colour will replace the colour with the lowest index value (this is the number of the colour row in the Colour Ranges table) in the column, the remaining colours will be updated automatically to follow the sequence.
Colour legends are stored in a colour scheme file (.scd). These files are displayed under the Specifications folder of the Vulcan Explorer. A single colour scheme file can contain up to 500 legends and the maximum number of entries per legend is 256.
Click ![]() Save icon to save changes to the current colour scheme file (
Save icon to save changes to the current colour scheme file (.scd).
Use the ![]() Save As option to save the currently selected colour scheme file (
Save As option to save the currently selected colour scheme file (.scd) under a different name. Enter the name for the new file. By default, the resulting file will be created in your current working directory. Use the available navigation buttons to nominate a different storage location.
Close the Legend Editor by clicking the X icon of the tabbed window.


