Contour
Create Contours over a Grid Mesh/Triangulation
Use the Contour option to apply contours to either grids or triangulations. For a grid the contour lines are generated by mapping across the grid cells. For triangulations, each contour segment will be a straight line across each triangle.
Note: Once contour lines have been added, they can be removed by using Model > Contouring > Remove.
Instructions
On the Model menu, point to Contouring, then click Contour.
Note: If no surface model is loaded onto the screen, you will be prompted to load one first before the panel displays.
Depending on whether you selected grid or triangulation, the respective contour panel displays. However, both the panels function the same way.
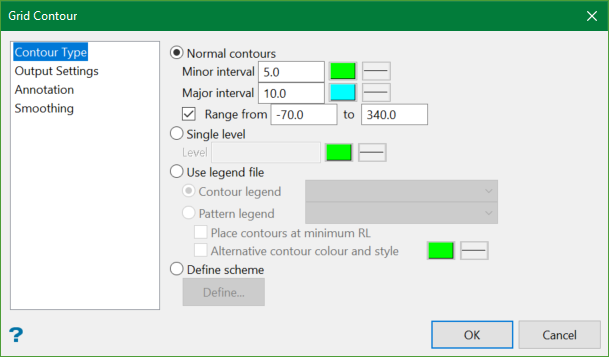
Contour Type
There are four different contouring methods:
Normal contours
Select this option to create contours at specified intervals between a given range on the model. You will need to specify the minor and major contour intervals, as well as the contour range. Leave the contour range blank to create all contours.
The major interval must be a multiple of the minor contour interval. The contours will be placed at the starting level plus multiples of the minor contour interval.
If the start value is 256 , minor contour interval is 5.00 and the major contour interval is 10.00 , then minor contours would be created at 261, 271 etc. and major contours at 266, 276 etc. You can use the same value for both the major and minor intervals. In this case only major contours are created.
Single level
Select this option to create one contour at a specified level. A message displays if you enter a level outside the model area.
Use legend file
Select this option to create contours using a nominated colour legend (contour or pattern).
To create a new contour legend, leave the available field blank. Once the Triangle contour - Contour attributes panel has been completed, the Colour Scheme panel displays. Colour legends can also be created using the Analyse > Legend Edit > Legend Editor option. A pattern type colour legend must exist prior to selecting the Contour option.
If the model is outside the range of the scheme, then a message displays informing you that the scheme is not suitable for the surface. You may also be informed that some modification to scheme ranges is necessary to eliminate overlap conflicts. This occurs when the boundaries of the intervals are the same.
Define scheme
This option allows you to define the lower and upper Z-level boundaries for the contour lines.
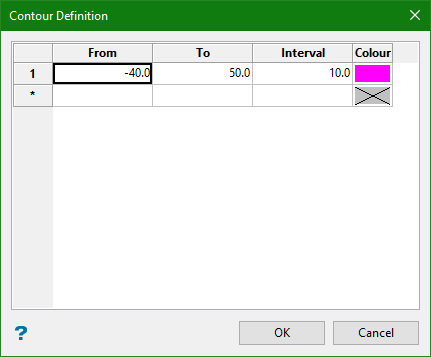
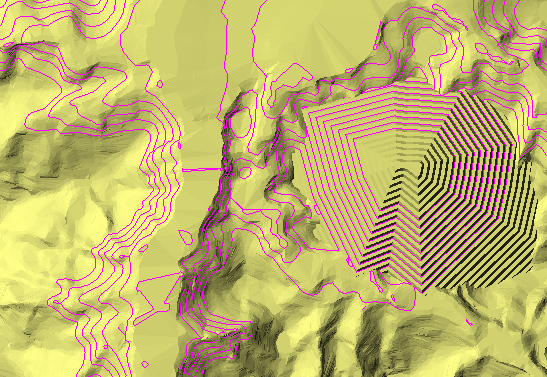
Figure 1 : Contour lines have been limited to the elevation levels shown in the panel above, with an interval of 10 units.
Note: The units can be set to either Metric or Imperial by selecting the Scale Factor found in the Preferences > Miscellaneous.
From
Enter the lowest Z-value.
To
Enter the highest Z-value.
Interval
Set the elevation distance between the contour lines.
Colour
Select a colour for the contour lines.
Output Settings
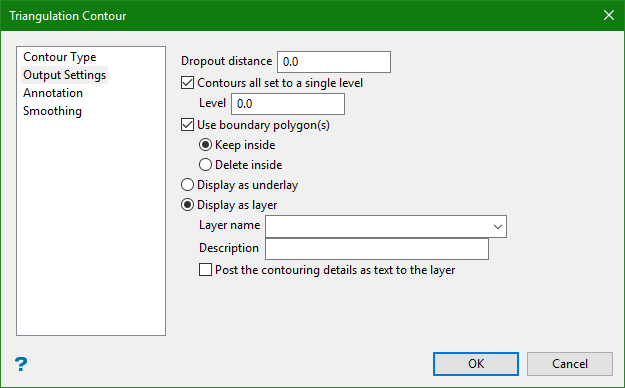
Dropout distance
Minor contours are eliminated if the ground distance (plan view distance) between contours is less than this value. If you do not want dropout to occur, then set the dropout distance to 0.
Contours all set to a single value
Select this option to set the Z value of all of the points in the contours to a specified Z value. The original Z value of each contour is stored in the object value. This can be seen through using the Analyse > Details > List option.
Boundary polygons
Select this option to contour a surface only in a selected polygon.
Display as underlay
Select this option to display the contours as an underlay.
Note: Underlays cannot be saved resulting in your contours being lost once you close the current Vulcan. Use the File > Underlays > Convert to Object option if you want to convert the contents of the underlay into standard Vulcan design strings.
Display as layer
Select this option to place the contours in a nominated layer.
Post the contouring details as text to the layer
Select this check box to display information, such as the smoothing method, relating to how the contours were generated. The position of the display on the screen is specified once all of the contouring panels are completed. This option is only applicable when saving the contours in a layer.
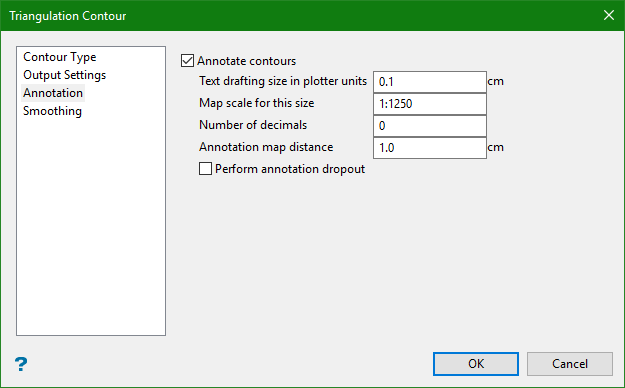
Annotate contours
Select this check box to annotate the major contours as they are generated (minor contours are not annotated).
Text drafting size in plotter units
Enter the size, in plotter units, of the text on the plot. The specified value will also be used to define the size of the point markers on the plot.
Map scale for this size
Enter, as a ratio, the drafting scale, which is used in conjunction with the text size entered above.
Example: If the text size is set to 0.10 (10 cm), and the drafting scale to 1:1250 , then the text will appear on the screen the same size as an object that is 125 units long. Changing the scale, through either this option or the File > Plot > Plot All option to 1:1000 will result in the text appearing the same size as an object that is 100 units long. Changing the scale to 1:10 000 results in a text size of 1000 and so forth.
Number of decimals
Enter the number of decimal places that you want to be used.
Perform annotation dropout
Use this to filter the annotation labels when the contour lines are spaced closely together.
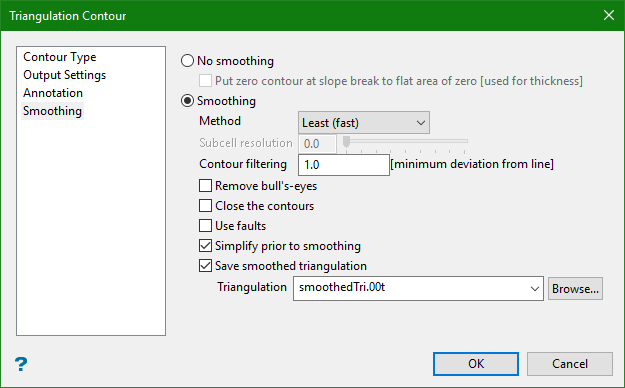
No smoothing
Select this option if you don't want to apply any smoothing.
Put zero contour at slope break to area of zero
Select this check box to generate a contour line enclosing flat triangles. This is useful when contouring thickness triangulations. Normally, a contour encloses all of a particular area greater than or equal to a given level.
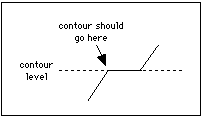
Figure 2 : Zero Contour Option Unticked (Section View)
In the special case of a contour at 0 (zero), ticking this option forces the contour to enclose areas greater than the level (rather than greater than or equal to the area).
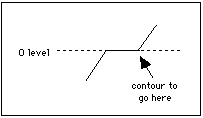
Figure 3 : Zero Contour Option checked (Section View)
Apart from contouring a thickness triangulation, this is also useful to create a limiting string for area or volume calculations.
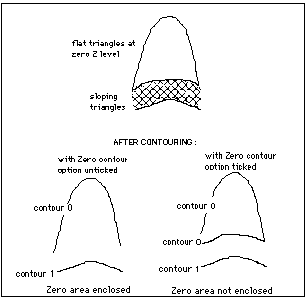
Figure 4 : Zero Contours Option On or Off (Plan View)
Smoothing
Method
-
Least smoothing - This option performs contouring with a subcell resolution of 1 for grids and 3 for triangulations. This is the quickest method.
-
Normal smoothing - This option performs contouring with a subcell resolution of 2 for grids and 4 for triangulations. This is the most commonly used method.
-
Extra smoothing - This option performs contouring with a subcell resolution of 3 for grids and 5 for triangulations. This is the slowest method.
-
Custom - This option performs contouring according to a specified subcell resolution (between 0 and 8).
Note: The smoothing process takes longer for triangulations than for grids. This is because in triangulations irregular spline patches are produced and the blending, which is required at the edges of these irregular spline patches to produce a smooth surface, requires more processing time. The time needed to create the contours will also be increased when extra smoothing is used.
Tip: Smoothing should not be applied to triangulations that were generated without selecting the option Generate spur strings. Using such triangulations with large flat areas can produce undesirable artifacts during smoothing and subsequent contouring.
Subcell resolution
Smoothing is performed by interpolating values (called subcells into the model). The degree of interpolation determines the "smoothness" of the contours. Subcell values are determined from bicubic spline patches in the case of grids and 5th order spline patches in the case of triangulations. A subcell resolution of 1 gives 4 subcells (i.e. each grid cell or triangle is split into four smaller grid cells or triangulations), a resolution of 2 gives 16, a resolution of 3 gives 64 etc. In general, triangulations need a greater degree of interpolation because triangles cover a much larger area than grid cells.
Tip: If you want to close the contours, but not perform any smoothing, then we recommend that you use Custom smoothing by subcell resolution option and set the resolution value to 0.
Contour filtering
Select this check box to filter surplus points in the contour strings. The surplus points are produced as a result of smoothing a splined surface.
Remove bull's eyes
Select this check box to remove contours that fall entirely in a triangle or grid cell. Spline surfaces may produce undesirable hills and depressions. These are recognised by nested contours falling entirely in the same triangle.
Close the contours
Select this check box to close the contours. This option is only applicable when a smoothing option has been selected and the surface is a triangulation. This option won't be displayed for grids.
Use faults
Select this option to incorporate fault lines into the contouring process. The fault lines must be included in the triangulation, i.e. they must have been part of the data used to create the triangulation. Once this panel is completed, you will be prompted to pick the faults (breaklines). Contours are not smoothed across fault lines.
Note: This option is only applicable when a smoothing option has been selected and the surface is a triangulation. This option won't be displayed for grids.
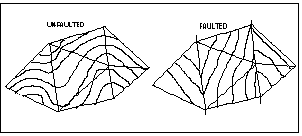
Figure 5 : Faults
The Colour options are displayed if you have chosen to create normal contours or to contour one level. For normal contours, select a colour for the major and minor contours. For one contour level, select the colour for the contour.
Note: If the major and minor intervals are the same, then you can only select one colour.
Simplify prior to smoothing
Select this option to filter the data points used to make up the contour lines. This can be useful for extremely large datasets because the smoothing process will add points to a line in the splining process.
Save smoothed triangulation
Select this option if you want to save the results as a surface triangulation.
Click OK.

