Plot All
Use this option to create a plot of the screen display. Underlays, such as grid mesh models or triangulations, are only included in the plot if you choose to save a WYSIWYG plot or to render non-CAD data as an image behind CAD elements. This option creates a compressed plot file (.vpgz) that ensures WYSIWYG plot files are not too large.
Tip: You can specify defaults, such as the page size, orientation, and scale, through Vulcan Preferences > Plot All. The size of point markers on the resulting plot is determined by the settings specified in Vulcan Preferences > Defaults > 2D Text.
Note: The Plot All option does not take vertical exaggeration into account. The panel remembers the most recent plot filename entered during the current Vulcan session. To avoid accidentally overwriting an existing plot file, change the file name each time a plot is generated. No warning is given before overwriting a file.
Instructions
Click the  Plot All button on the Standard toolbar.
Or
On the File menu, point to Plot, then click Plot All.
Note: If the current view is a rotated section view, you are prompted to align the view to the section plane.
Tip: You can realign the section view with the current view at any time by selecting  Align View With Current Slicing Plane on the Slice toolbar.
Template Details
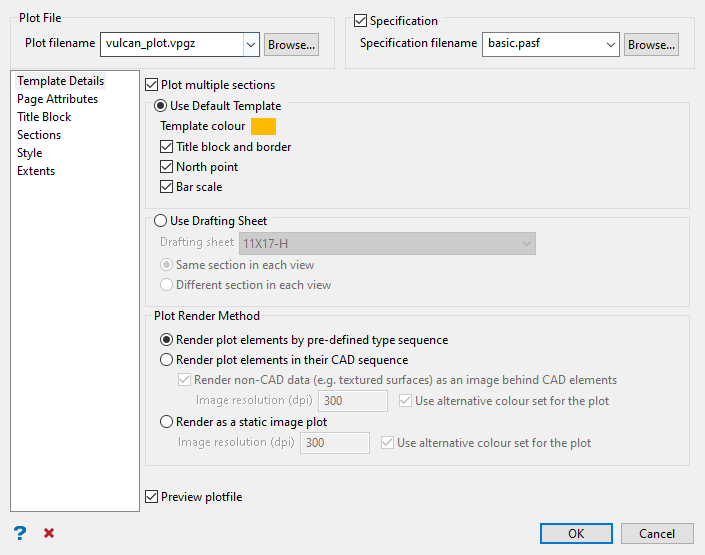
In the initial pane of the Plot All interface, specify the plot and specification file as well as template and rendering details.
Follow these steps:
-
Select a Plot filename from the drop-down list, which includes all (
.vpgz) files in your current working directory. You can also create a new file by entering a file name. To select or create a file in a different location, click Browse.... -
Select the Create or load specification file checkbox to load an existing Plot All specification file (
.pasf) or create a new one to save for future use when generating plot files. Choose a Spec filename from the drop-down list, which contains all (.pasf) files in the current working directory. You can also create a new file by entering a file name. To select or create a file in a different location, click Browse....Note: After nominating a Plot filename and Spec filename (as desired), you may click OK to create the plot file with the current panel parameters. Continue working through the panes in the Plot All interface if you would like to make changes to the plotting parameters before creating the plot file.
-
Select the Plot multiple sections checkbox if you want to plot more than one section.
-
Select whether to Use Default Template or Use Drafting Sheet:
-
Use Default Template: Select this option to use a dynamic template that will work for any paper size in either landscape or portrait orientation. If the default template does not meet the required plotting needs, a drafting sheet should be used instead.
Under this option, choose the desired Template Colour from the current colour table. You can also select the Title block and border checkbox if you want to include a title block and page border in the plot. If you enable the title block and border, you have the option to select checkboxes to include a North point and/or a Bar scale on the plot as well.
-
Use Drafting Sheet: Select this option to pick a drafting sheet from a drafting sheet database (
drafting.dgd.isis) located in the Resources folder (see more information in the Drafting Sheets Overview). Vulcan provides several default drafting sheets, but customised drafting sheets may be created through options in File > Drafting Sheets.If you select a drafting sheet that has more than one viewport and you enabled Plot multiple selections, you will need to select whether to plot Same section in each view or Different section in each view.
Note: If you select a drafting sheet that has more than one viewport, the Plot All panel tree structure will be updated to show grouped Style and Extents panes for each view, as well as Sections panes for each view if you select Different section in each view. These separate groups of panes allow you to customise plotting parameters for each viewport.
-
-
Select the desired Plot Render Method:
-
Render plot elements by pre-defined type sequence: Generates design data on the plot according to a hard-coded sequence:
-
Images
-
Filled polygons
-
Line objects
-
Text
Therefore, text is always plotted on top of lines, lines on top of filled polygons, and filled polygons on top of images (triangulations).
-
-
Render plot elements in their CAD sequence: Generates design data on the plot in the order in which it was loaded into Vulcan.
Under this option, you can select the Render non-CAD data (e.g. textured surfaces) as an image behind CAD elements checkbox to draw underlays, such as triangulations, before CAD data in the plot. This results in CAD data plotting on top of underlays. If this checkbox is selected, underlays will not show up on plots altered with File > Plot Edit options. If you select this checkbox, you can also set the Image resolution (dpi) for the rendered non-CAD data and whether or not to Use alternative colour set for the plot.
-
Render as static image plot: Generates a screen capture of loaded data. Data elevations and position in space are honoured.
With this option, Image resolution (dpi) should be between 100 and 300. Resolutions greater than 300 create large plot files without any improvement in plot appearance. Drillholes are rendered as CAD data unless a triangulation is plotted. Drillhole traces will plot under triangulations at intersection locations. With this option, you can also select whether to whether or not to Use alternative colour set for the plot.
Note: Prior to Vulcan 8.2, plots were rendered in the order that they were created in the plot file. This occasionally caused problems with items being hidden or clipped. The updated rendering options included in Vulcan eliminate these problems.
The following table summarises how each plot render method affects plotting in Vulcan:
Render plot elements by a pre-defined type sequence Render plot elements in their CAD sequence Render as static image plot Object type affects plot priority or sequence Yes, Object type sequence is honoured. No, not for lines and filled polygons. No Object creation order affects plot priority or sequence Partially. Creation order is only honoured within each Object type. Yes. This is true for lines and filled polygons. Type is completely ignored. Text creation sequence is honoured but text is always plotted on top. No; however, within each Object type, creation order is honoured if elements share the same 3D position. Layer loading sequence affects plot priority Yes, for lines and filled polygons. # is limited. Yes, for lines and filled polygons. No Text is always on top regardless of the loading order or creation order Yes Yes No Plots Triangulations No Yes, when Render non- CAD data as an image behind CAD elements is checked. Yes Plot element 3D position affects plotting priority or sequence. That is, position in Z (height) if in top view No No Yes Plots data as it appears on screen in Vulcan No No Yes Where:
-
Object type refers to the four object types in Vulcan plotting: images (triangulations), filled polygons, line objects, and text.
-
Object creation order means that objects created more recently plot on top of older objects for lines and points.
-
Layer loading sequence means that layers loaded more recently plot on top of those loaded earlier.
NoteFilled polygons in more recently loaded layers will plot on top of those in earlier loaded layers, however the object type sequence is still honoured regardless of the loading order.
For filled polygons, the Emulate transparent patterns checkbox option in Vulcan Preferences > Plot Utility can also be used to ignore creation order and/or layer loading sequence.
-
-
Select the Preview plotfile checkbox if you want to preview the resulting plot file through the Workbench > Tools > Plot Utility option.
Page Attributes
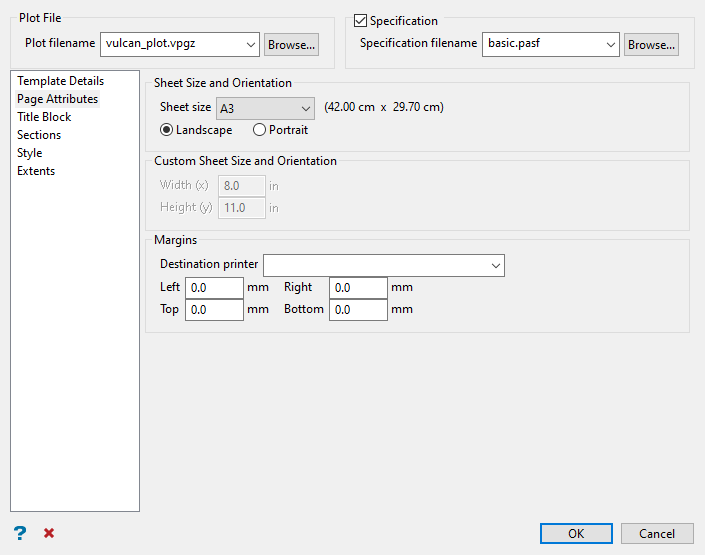
Use this pane to specify the page size, destination printer, and page orientation.
The Page Attributes pane is only available if the Use Default Template option is selected in Template Details.
The defaults on this panel are specified in Vulcan Preferences > Plot All (scale, page size, and orientation) and Vulcan Preferences > Plot Utility (default plotter/destination printer).
Follow these steps:
-
Select the Sheet Size from the drop-down list.
If you select Custom, then you will have the ability to specify Width (x) and Height (y) of the sheet. The measurement units, i.e. centimetres (metric) or inches (imperial), for the height and width values are defined in Vulcan Preferences > Miscellaneous.
Note: The minimum custom page size is 1.0 cm/inch by 1.0 cm/inch.
-
Specify the page orientation as either Landscape or Portrait. It is also possible to change the orientation through Plot Utility. If you are using a custom page size, then these options will be disabled, that is, unavailable.
-
Select the Destination Printer from the drop-down list. The margins for the selected printer's default page size are then displayed in the Margin section of the panel. If you are using a different page size than the default page size, then the margins may differ slightly.
Title Block
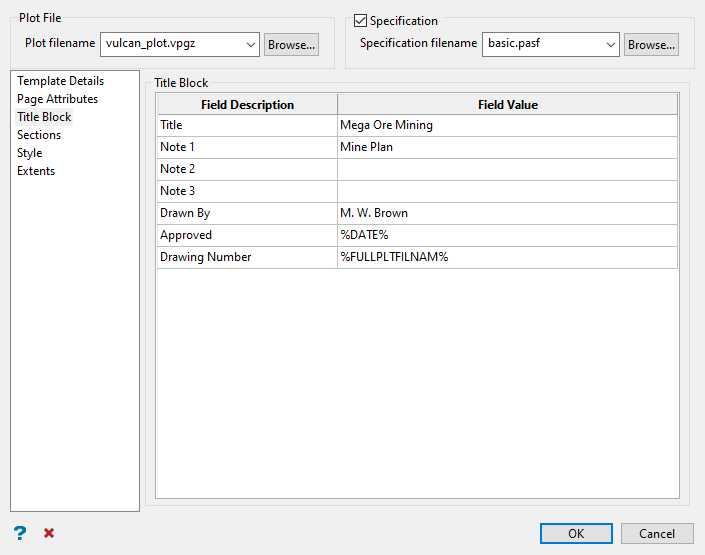
Use this pane to specify the title block and any user field information.
Follow these steps:
-
Enter the appropriate information for the title block title and notes in the Field Value column.
ImportantThe fields described in these steps are only applicable for the title block pertaining to the Use Default Template option with the Title block and border checkbox enabled. Title blocks for the Use Drafting Sheet option are specific to each drafting sheet, so the grid in this pane will vary with applicable Field Names to provide entries for.Up to four title lines can be entered:
Field Description Note Title Displayed as a heading. Can contain up to 30 alphanumeric characters. Note 1 Centred within the left column of the title box. Can contain up to 30 alphanumeric characters. Note 2 Centred within the left column of the title box. Can contain up to 20 alphanumeric characters. Note 3 Centred within the left column of the title box. Can contain up to 30 alphanumeric characters. The following table contains a list of supported plotting variables that can be entered in the fields as desired.
Variable Text Plotted %XAVG% Average Easting %ZAVG% Average Elevation %YAVG% Average Northing %X%, %EAST%, %EASTING% Easting %Z%, %RL%, %ELEV%, %ELEVATION% Elevation %Y%, %NORTH%, %NORTHING% Northing %XMAX% Maximum Easting %ZMAX%, %CREST%, %BACK%, %ROOF% Maximum Elevation %YMAX% Maximum Northing %XMIN% Minimum Easting %ZMIN%, %TOE%, %SILL%, %FLOOR% Minimum Elevation %YMIN% Minimum Northing %COUNTER% Plot file counter %PLTFILNAM% Plot file name %FULLPLTNAM%, %FULLPLTFILNAM% Full plot file name %SC%, %SCALE% Scale %DATE% Date -
Enter the name or initials of the person who created the plan in the Drawn By field (a maximum of 6 alphanumeric characters).
-
Enter the name or initials of the person who approved the plan in the Approved field (a maximum of 6 alphanumeric characters).
-
Enter the Drawing Number (a maximum of 10 alphanumeric characters).
Sections
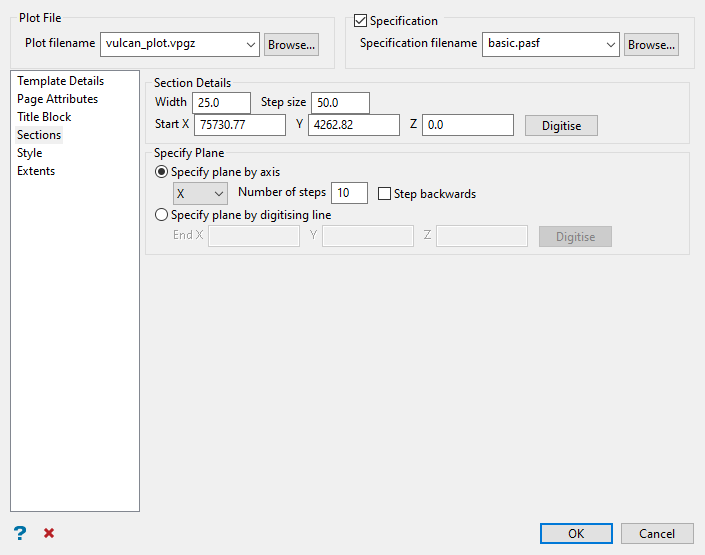
Use this pane to define the sections you wish to plot.
Note: The Sections pane is only available if the Plot multiple sections checkbox is selected in Template Details. Also note that if you chose to use a drafting sheet with more than one viewport and selected the Different section in each view option, you will need the complete the Sections pane specific to each view.
Follow these steps:
-
Define the Section details to configure the section Width, Step size, and the Start X, Y, and Z point for the sections. The step size value refers to the distance between each section. You can also select Digitise to pick a start point on screen instead of entering the X, Y, and Z location.
-
Define the plane along which to create the sections as well as the number of sections to create by selecting either Specify plane by axis or Specify plane by digitising line:
-
Specify plan axis: Select either X, Y, or Z plane from the drop-down list and specify the number of sections in the No of steps field.
You can select the Step backwards checkbox to reverse the direction in which to advance the sectioning.
-
Specify plane by digitising line: Enter the End X, Y, and Z point of the line that defines the plane (note that the start point of the line is defined in the Section details section). You can also select Digitise to pick an end point on screen instead of entering the X, Y, and Z location.
-
Style
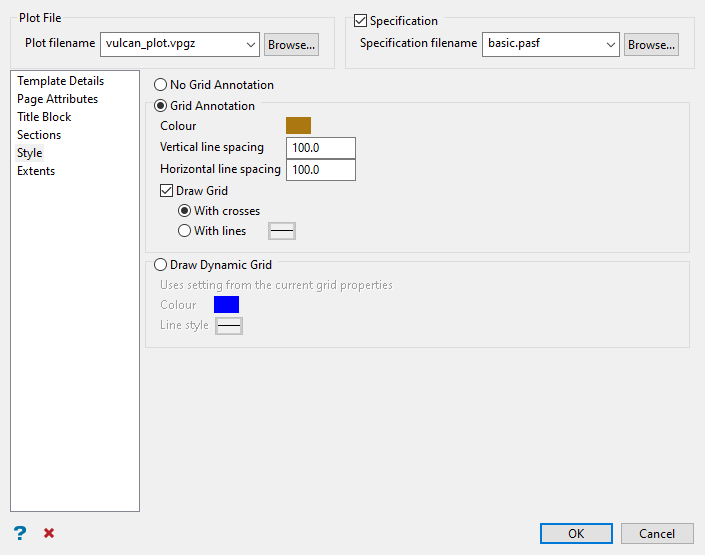
Use this panel to specify grid and grid annotation attributes.
Note: If you chose to use a drafting sheet in Template Details with more than one viewport, you will need the complete the Style pane specific to each view.
Follow these steps:
-
Select one of the following options to define the plot grid style:
-
No Plot Grid Annotation: Select this option if you do not want to include grid annotations within your resulting plot.
-
Plot Grid (XYZ) Annotation: Select this option if you want to create XYZ grid annotations around the edge of the plot. Specify the vertical and horizontal grid spacing and the colour for the grid. The colour is selected from the current colour table.
Check the Draw Grid checkbox if you want to draw the grid onto the plot. If this checkbox is selected, you will need to specify whether to use crosses or lines to represent the grid.
-
Draw Dynamic Grid: Select this option if you want to draw the dynamic grid on the plot. Dynamic grids are grids displayed on the screen via the
 Toggle Grid Display icon on the Graphics toolbar or via Analyse > Grid > Apply. Select a colour and line style for the dynamic grid. The colour is selected from the current colour table.
Note: If a WYSIWYG plot is being created, then any grid on the screen will be displayed as part of the screen dump even if no option to create a grid on the plot is selected from the Plot All panel. If you do not want a grid to be displayed in the resulting plot, then you must first turn off the grid screen display before generating a WYSIWYG plot.
-
-
Advance to the next pane in the Plot All interface.
Extents
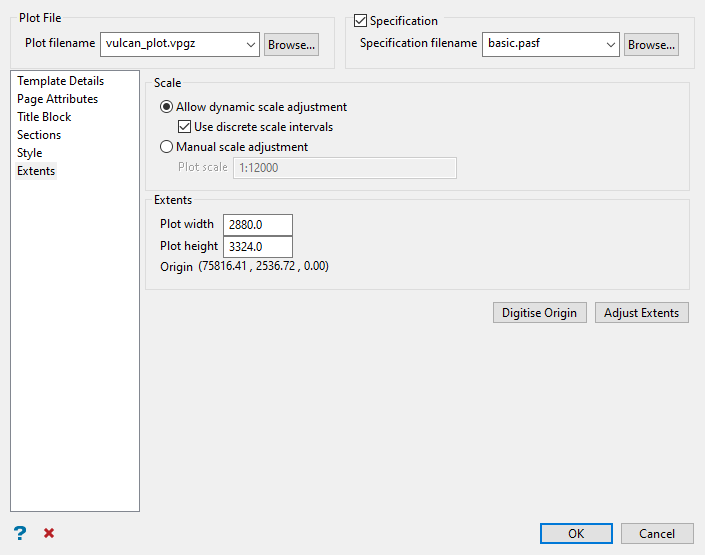
Use this pane to specify the plot extents and scale.
Note: If you chose to use a drafting sheet in Template Details with more than one viewport, you will need the complete the Extents pane specific to each view.
Follow these steps:
-
Select between Allow dynamic scale adjustment and Manual scale adjustment:
-
Allow dynamic scale adjustment: Select this option if you want to be able to alter the size of the plot extent when you select the Adjust Extents button.
Select the Use discrete scale intervals checkbox in this option if you want to force the scale to be rounded discrete values when adjusting the extent.
Example: 1:100 or 1:1000.
-
Manual scale adjustment: Select this option if you want to manually enter the scale. Specify the desired scale in the Plot Scale field in the format 1:<n>. With this option, you will only be able to alter the location of the extents box with the Adjust Extents button. That is, you will only be able to drag the plot extent rectangle to a new location, but you will not be able to increase or decrease the size of the extent.
If the scale was 1:1250, then a 1 cm object on the plot would be 1250 units in the real world. The default scale is derived from the Vulcan Preferences > Plot All.
Alternatively, if you entered 100 and your real world units are feet and the plotter units are inches, then 1 inch represents 100 feet, i.e. the scale is converted to 1:1200. This conversion takes place when you move to another panel field.
Note: If you are using imperial plotter units, then you can enter a single number for the scale. The scale is then converted in such a way that one plotter unit represents the entered number of real world units.
-
-
Enter the Plot width and Plot height for the plot extents as measured in world units (as specified in your project specification file [
.dg1]). You can change these values to alter the plot extents. Use the Adjust Extents button to move the extents. -
Select the Remember extent settings checkbox to use the current scale and extent settings as the default settings for each plot created in the current Vulcan session.
-
Optionally, you can use the buttons at the bottom of the panel to manually shift the plot extents:
-
Digitise Origin: Select this button if you want to digitise the origin (lower left corner) of the plot extents. You can use one of the snap modes (
 Snap To Points or
  Snap To Objects) or
  Key In Point Data on the Digitise toolbar to specify the origin.
Note: The coordinates of the plot origin are displayed in the bottom left corner of the plot extents rectangle.
-
Adjust Extents: Select this button if you want to alter the location (and size, if the Allow dynamic scale adjustment option is selected) of the plot extent. Once selected, a rectangle representing the plot extent is displayed on the screen. The current scale is displayed in the bottom left corner.
To move the extent, click on one of the sides of the rectangle and drag it to the new position. To resize the plot extent (only possible if the Allow dynamic scale adjustment option is selected), click on one of the corners of the rectangle and drag it. Right-click when you have finished altering the plot extent rectangle.
NoteThe plot extents rectangle represents the data element area of your chosen page, not the complete page area.
Resizing the rectangle will not alter the page size (set previously in the Plot All interface). The scale will be altered in such a way that the data inside the box will fit onto the page. Thus adjusting the extent allows the system to determine an appropriate scale.
-
Creating the plot file
Click OK to create the specified plot file with the current panel parameters and, if applicable, preview through Plot Utility. If you chose to create a Plot All specification file (.pasf), then the resulting file will be stored within the specified directory.
Alternatively, click Cancel to close the Plot All panel without saving changes. You can also click  Clear Panel if you would like to clear the panel settings.

