Control Points
Set Control Points
The Control Points option to set annotated control points and generate a control points table. Control points can be used as absolute or relative reference points for design work, even though the points themselves are not to be included, for example newly digitised data can be precisely positioned with respect to control points whose positions have been accurately surveyed.
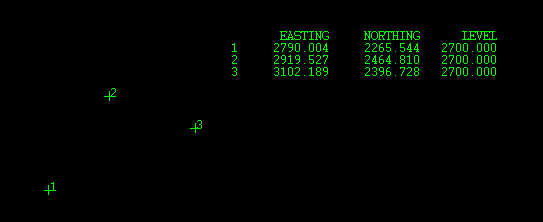
Figure 1 : Control Points and Control Points Table
Instructions
On the Design menu, click Control Points to display the Generate control points panel.
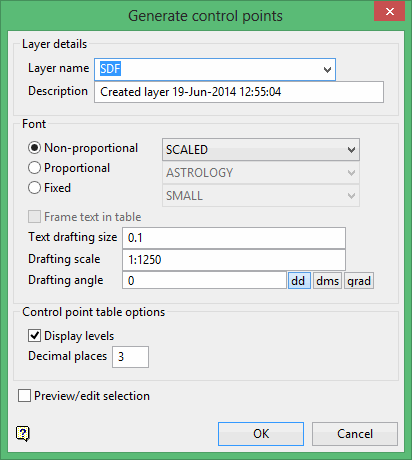
Layer details
Layer
Select the layer that will be used to store both the control points and the control points table.
The drop-down list contains the names of all currently loaded layers. If you select an existing layer, then the resulting data will be appended to the nominated layer. If you enter the name of an existing layer that is not currently loaded, then you will need to confirm whether you want to load the layer or replace it, i.e. overwrite its contents.
To create a new layer, enter the layer name. The layer name:
-
- may contain up to 40 characters.
- must begin with an alphanumeric character [0-9] or [a-z].
- cannot include spaces.
- can include hyphens [ - ], plus signs [ + ], underscores [ _ ], periods/dots [. ].
- can include the special characters of ÁÂÃÀÇÉÊÍÓÔÕÚÜÑ that are used in the Spanish and Portuguese languages.
Description
Enter a description to further describe the contents of this layer. The description can be up to 80 alphanumeric characters and may include spaces. If a description is not entered, then a default description will be used instead. If the chosen layer already has an assigned description, the description displays when the layer is selected. Existing layer descriptions can be overwritten.
Font
Select the font type, that is non-proportional, proportional or fixed, followed by the actual font.
Fixed fonts remain the same size when displayed onscreen regardless of the current zoom, and will always appear 'face on' (horizontal) regardless of the drafting angle. The drafting angle is only followed when a hard copy plot is produced.
Proportional and non-proportional fonts will resize as you zoom in/out, and the display will follow the angle set by the drafting angle. The main difference between proportional and non-proportional fonts, is that proportional fonts are displayed using a fixed width, i.e. letters are the same size, while non-proportional fonts are displayed using varying widths.
Frame text in table
Select this check box to place a frame or box around the control points table. The resulting frame is used for display purposes only and will not be plotted. This check box can only be used when using fixed fonts.
Text drafting size
Enter the size, in plotter units, of the text on the plot. The specified value will also be used to define the size of the point markers on the plot.
Drafting scale
Enter, as a ratio, the drafting scale, which is used in conjunction with the text size entered above.
For example: If the text size is set to 0.10 (10 cm), and the drafting scale to 1:1250 , then the text will appear on the screen the same size as an object that is 125 units long. Changing the scale, through either this option or the File > Plot > Plot All option to 1:1000 will result in the text appearing the same size as an object that is 100 units long. Changing the scale to 1:10 000 results in a text size of 1000 and so forth.
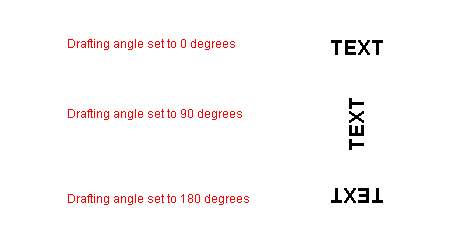
Drafting angle
Enter the angle at which the text block will appear. Fixed fonts will always be displayed horizontally when viewed onscreen. The resulting text, however, will appear at the correct angle when plotted.
The drafting angle can be entered in decimal degrees; degrees minutes seconds ( ddd.mm.ss ) or gradians. To do so, select the appropriate angle format button and enter the drafting angle.
For example: To enter a drafting angle of 50°, select the ![]() button and enter
button and enter 50 as the drafting angle. Select a different angle format button to convert a value, for example 50° will become 55.555556 if the ![]() button is selected.
button is selected.
Figure 2 : Drafting Angles
Control point table options
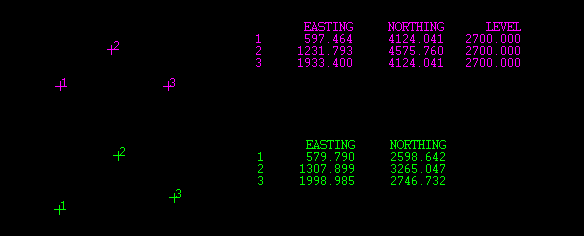
Display levels
Select this check box to display the Z level for each control point in the control points table. If this check box is not checked, then only the X and Y values displays.
Figure 3 : Displaying Z Levels
You can specify the number of decimal places to display in the resulting table. The maximum number of decimal places allowed in a single label is 6. The default number of decimal places is derived from the Miscellaneous section of the Tools > Preferences option.
Check the Preview/edit selection check box to preview and, if desired, modify the control point details before saving the information in the layer. The control point details will be displayed through the Control points preview panel. The Control points preview panel will allow you to edit point names as well as coordinate information.
Select OK.
The following panel is then displayed.
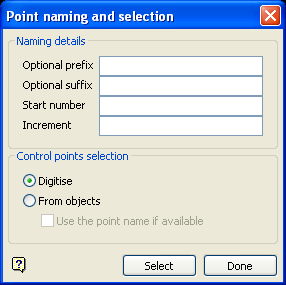
Point naming and selection panel
Naming details
Enter the number with which to start labelling the control points. The start number will be incremented by a nominated increment value for each control point generated. An optional prefix and suffix value can also be assigned to the control points.
Control points selection
The resulting control points can either be generated through manually indicating each control point onscreen or through using an existing design object, for example a line, polygon or point cloud. When using a design object a control point will be generated at each point location in the nominated object.
Check the Use the point name if available check box if you want the resulting control points to inherit the point names of the nominated design object.
Note: The nominated design object must be displayed onscreen prior to using the Control Points option.
Press the Select button when you are ready to create the control points.
Using any of the available design entry modes, indicate the control points onscreen. If you chose to create the control points using an existing design object, then the Multiple Selection box displays instead. From the displayed dialog box, nominate a selection method followed by the necessary objects. Once the objects have been chosen, the Multiple Selection box will be redisplayed allowing you to select more objects.
Cancel with the mouse when you are ready to return to the Point naming and selection panel. Press the Done button when you are ready to create the control points table.
You will be prompted to indicate where to place the control points table. If you checked the Preview/edit selection check box (on the Generate control points panel), then the Control points preview panel displays before you are prompted to indicate a position for the control points table.
Figure 4 : Control points preview panel
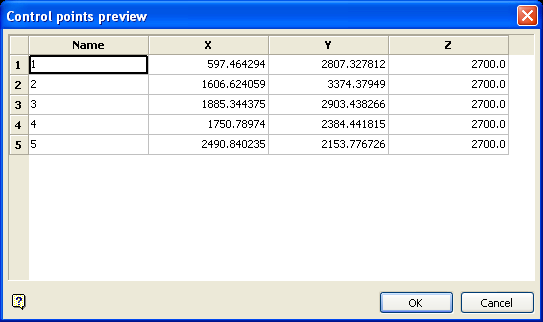
To edit point details, click in the applicable field before entering the new value.
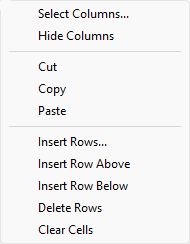
The panel utilises grid controls to manage the grid information, i.e. right-click context menus, that allow you to perform options such as hiding columns, cutting, copying, and pasting cells, and inserting and deleting rows. Right-click in the grid area to display the context menu. Descriptions of the available options are listed below.
-
Use the Select Columns option to choose which grid columns to display in the panel, and optionally save the selection to a template for future use. Alternatively, select cells and click Hide Columns to hide the respective columns directly.
-
Select cells and use the Cut, Copy, and Paste options to duplicate or move cell entries.
-
Select a cell in a row of interest and use the various insert and delete row options to manage the records in the grid.
-
Click Clear Cells to clear the contents of a selection.
Select the OK button to display the control points as well as the control points table.
The resulting control points and control point table will be assigned the following attributes;
| Object Type | Object Name | Group Code | Feature Code |
|---|---|---|---|
| Control points | CP_POINTS | N/A | CP_ANNOTAT |
| Control point annotations | CP_ANNOTATE | N/A | CP_ANNOTAT |
| Control points table | CP_TABLE | CP_TABLE | CONT_PNTS |
Use the Delete option (under the Design > Point Edit submenu) to delete specific control points. The Delete option (under the Design > Object Edit submenu) can be used to delete either the control points table or all of the control points.

