Tutorial - Support Analysis
This tutorial provides step-by-step instructions on how to use the Support Analysis feature.
Support Analysis Overview
Support Analysis
The Support Analysis tool allows you to model grade distribution from samples databases as if they were used to create resource block models at a given block size. The tool can use Affine, Indirect Lognormal correction, and Discrete Gaussian Model as the support change engines.
The analysis is performed using multiple variables and can use multiple cut-offs. An option to define materials using conditions lets you determine classification volumes based on adjusted grade distributions across multiple variables.
This feature requires Geostats Modeller or Base Geostatistics upgrade configurations.
Opening Your Data File in Vulcan
Instructions
The first step is to prepare and open your data file in Vulcan.
-
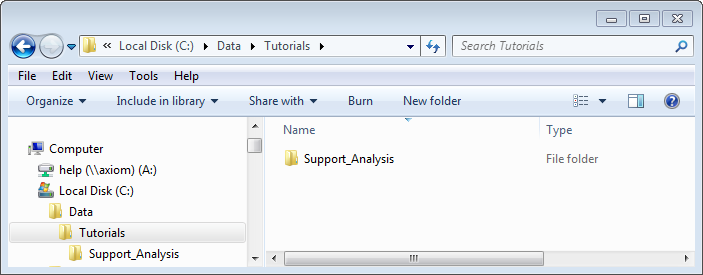
Create a new folder on your local drive. For this tutorial, we will use a folder called C:\Data\Tutorials\Support_Analysis\.
-
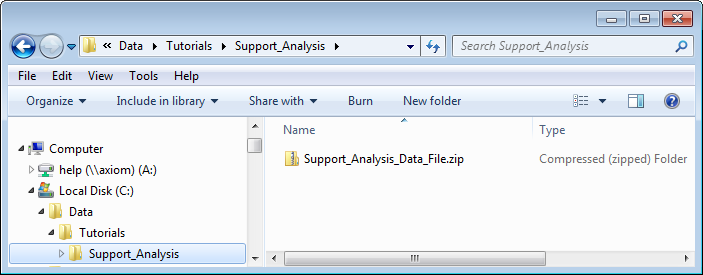
Download the sample tutorial by clicking the following link and saving the.zip file on your local drive: Support_Analysis_Data
-
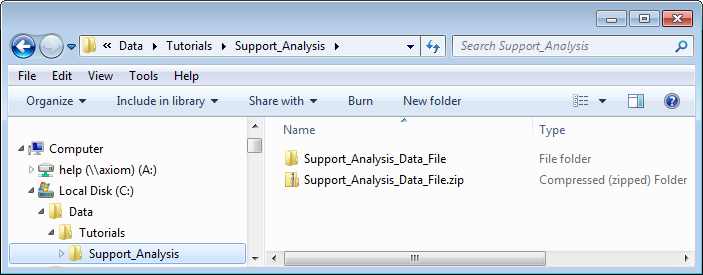
Extract the data from the.zip file to C:\Data\Tutorials\Support_Analysis\Support_Analysis_Data_File that contains the files required for this tutorial.
-
Open the Vulcan application using the unzipped files using one of the following methods.
To open Vulcan directly and browse to the data file folder:
- Double-click the Vulcan button on your desktop to open Vulcan.
- Browse to your data folder by clicking Browse in the Work Area Section of the Vulcan Launcher window.
- Select your data folder C:\Data\Tutorials\ Support_Analysis \Support_Analysis_Data_File and click OK.
- Click Vulcan.
- Select vartest.dgd.isis in the Design File drop-down menu.
To open Vulcan by clicking and dragging the data file:
- Click on your C:\Data\Tutorials\Support_Analysis\Support_Analysis_Data_File folder that you created in Step 3 and drag it on top of the Vulcan button in your desktop to launch Vulcan with the data from the folder.
- Click Vulcan.
- Select vartest.dgd.isis in the Design File drop-down menu.
Result:
The tutorial data that you extracted from Support_Analysis_Data_File.zip is now loaded.
Next step:
You can now load the layers containing the objects that you will analyse using the Support Analysis feature.
Using the Support Analysis Feature - Single Chart
Instructions
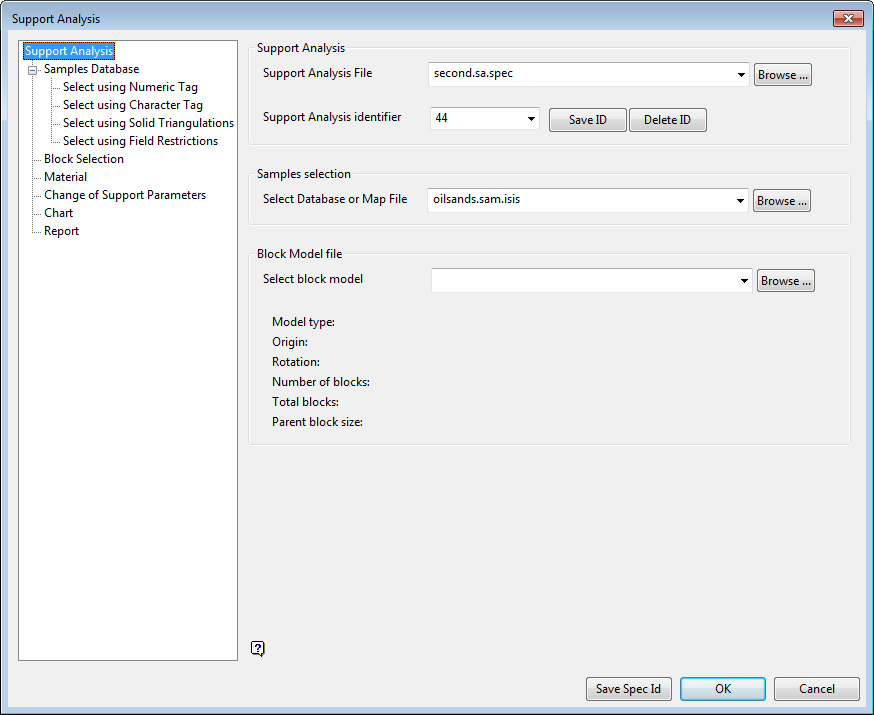
- Select Block > Grade Estimation > Support Analysis.
- Select second.sa.spec from the Support Analysis File drop-down menu.
- Select 44 from the Support Analysis identifier drop-down menu.
- Select oilsands.sam.isis from the Select Database or Map File drop-down menu.
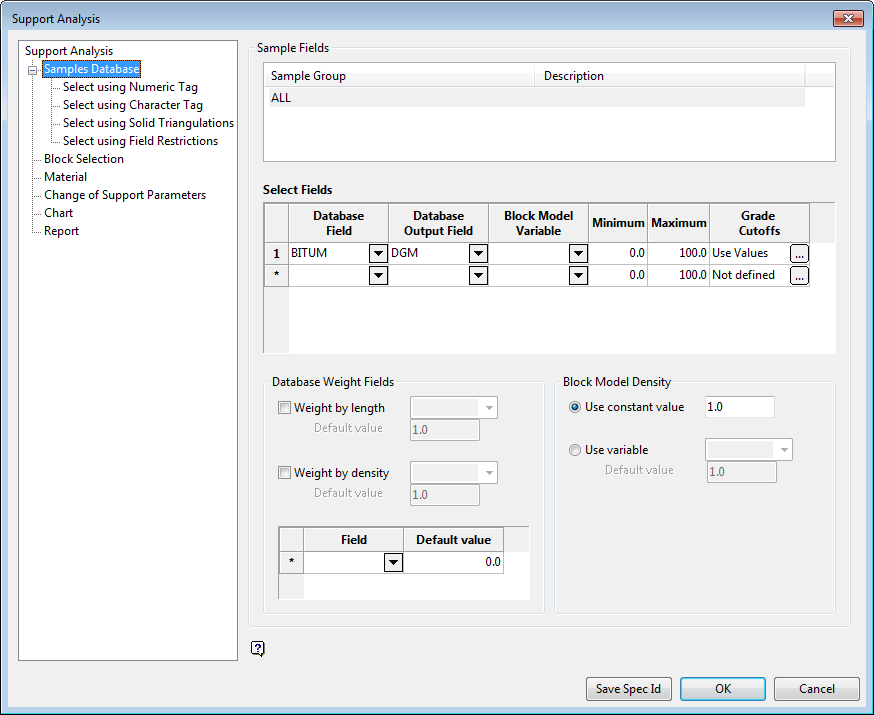
- Click the Samples Database branch in the left navigation panel and verify the following parameters:
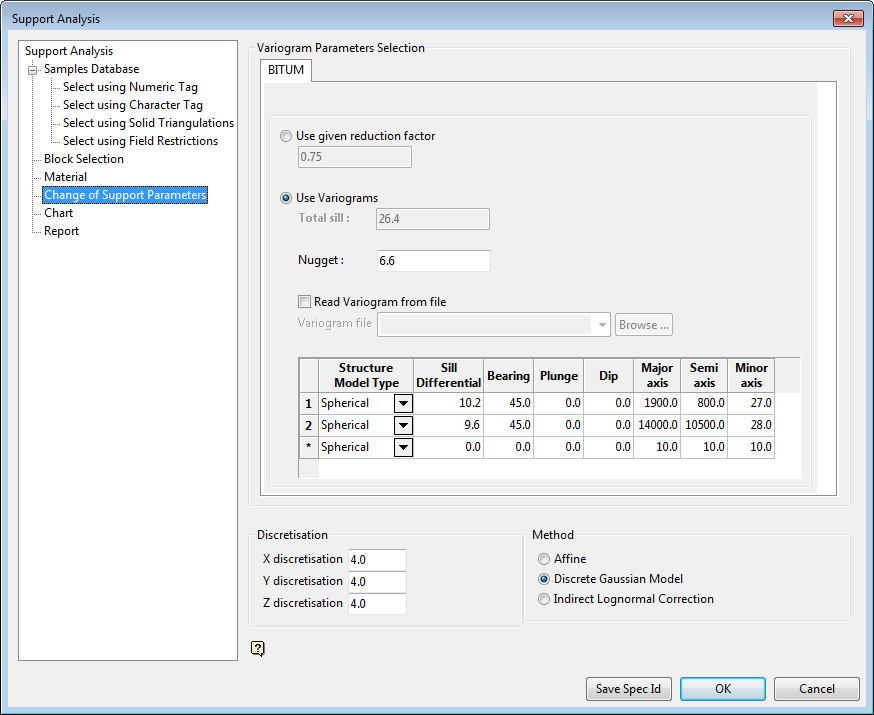
- Select the Change of Support Parameters branch in the left navigation panel and verify the following parameters:
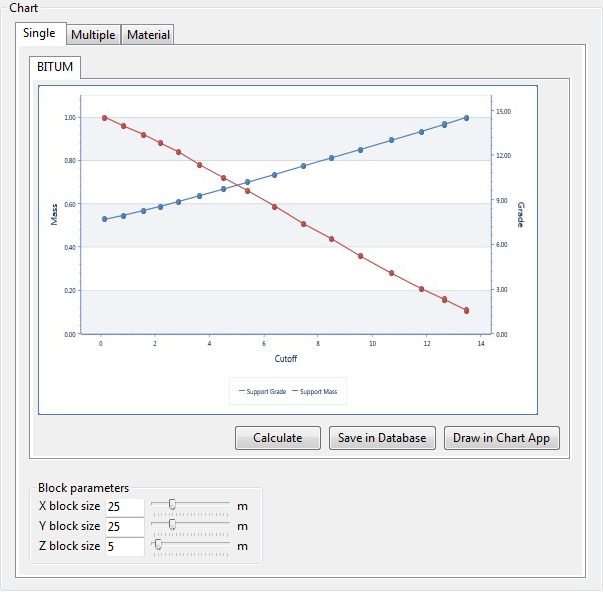
- Select the Chart branch in the left navigation panel and verify the following parameters:
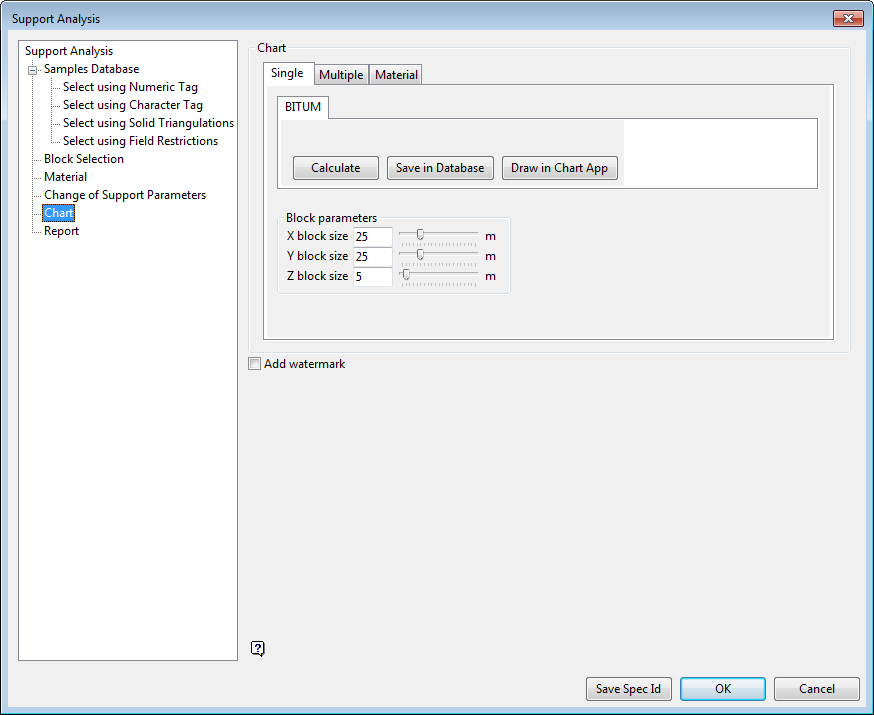
- Click Calculate. The following chart displays:
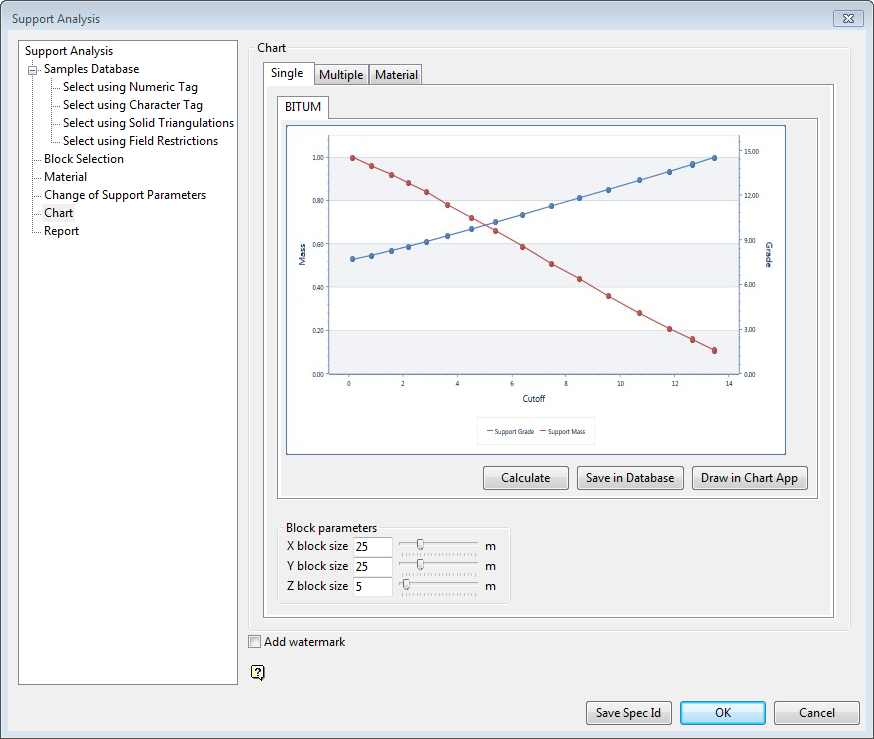
You can also click Save in Database to store the support changed values in your Isis database. The samples will then have support changed values in the DGM variable as specified in the Samples Database section.
You can also output the grade ton curve and reports into Excel by using the Report section of the panel and clicking Calculate again.
Related topics

