Advanced Statistics
General Setup
Use the Advanced Statistics option to generate statistics and graphs. The graphs can be displayed in Vulcan as well as generated directly in Microsoft Excel.
Instructions
On the Analyse menu, point to Statistics, and then click Advanced Statistics to display the following panel.
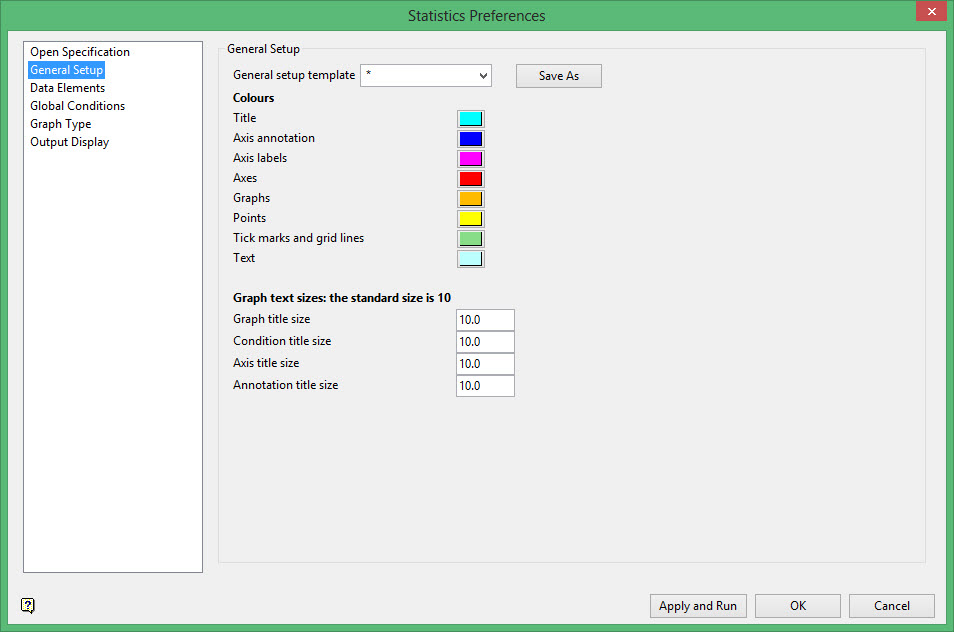
General setup template
Enter the name of the template to save to. The current state of the General Setup section (that is, all colours and graph text sizes) can be saved to a template. Select the Save As button to save the template.
Colours
Select colours for the graph elements, such as title text, axis annotations, axes labels, graphs (for example bars of a histogram), graph points, grid lines and text. Colour for text refers to the display of textual information other than title, annotation and labels. The colours will be selected from the current colour table.
Graph text sizes
Enter the size for the graph text (graph title, condition title, axes titles and annotation titles). The font type used is 'SCALED'. The font size of textual information is 10 point. This can only be changed through the options under the Design > Text Edit submenu.
Refer to the Font section (of the Vulcan introduction) for more information on scaled fonts.
Related topics

