Advanced Statistics
Output Display
Use the Advanced Statistics option to generate statistics and graphs. The graphs can be displayed in Vulcan as well as generated directly in Microsoft Excel.
Instructions
On the Analyse menu, point to Statistics, and then click Advanced Statistics to display the following panel.
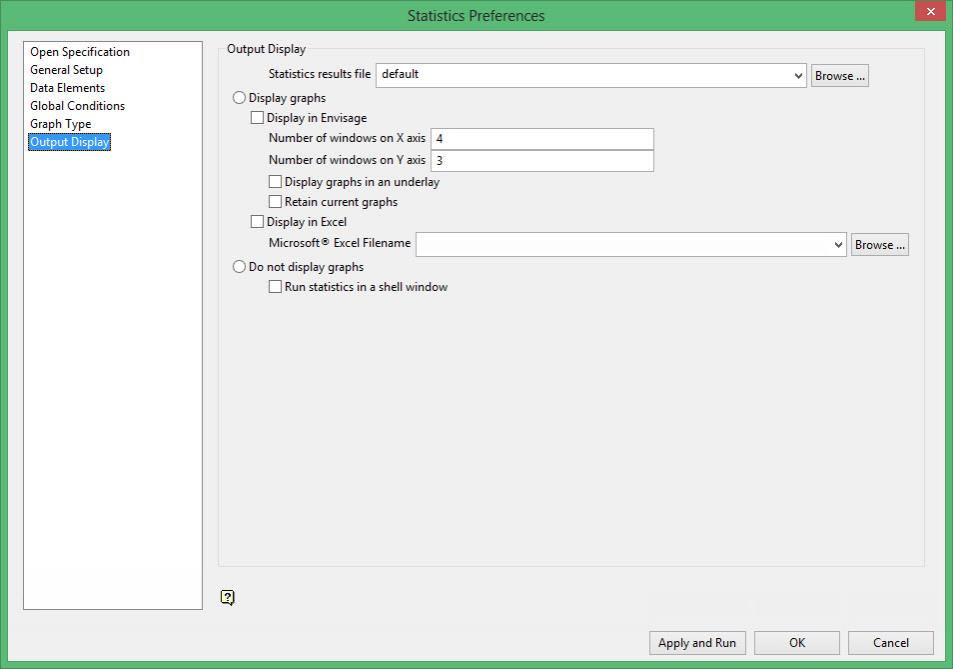
Output Display
Statistics results file
Enter, or select from the drop-down list, the name of the Statistics results file (.srf), or click Browse to select a file from another location. The format of the default file name is:
<specification_name>_<graphic>_<dataid>.srf
If the system encounters nay problems while running the statistics, the problem areas will be placed in a file with the same name as the results file and suffixed with an extension of.err.
Display graphs
Select this option to display the statistics/graphs.
If you enter '4' as the number of sub-windows for the X axis, and '3' as the number of sub-windows for the Y axis, you will get 12 sub-windows. If there are more graphs/statistics than the specified number of sub-windows, you will be able to scroll (by page or by graph).
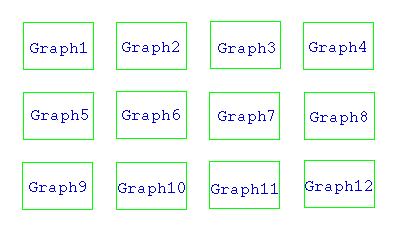
Figure 1: Sub-windows
Use the Zoom  and Pan
  icons on the Graphics toolbar to zoom in on the graphs/statistics.
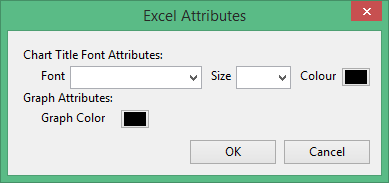
Excel Attributes
Use this panel to configure the font settings, including the font type, size, and colour, for the text elements within the graph.
Click OK to return to the Graph Type section of the Statistics Preferences interface.
Related topics

