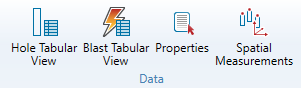
Data
The Data group of the Query ribbon contains tools to display hole and blast data and properties.
 Hole Tabular View
The Hole Tabular View tool allows you to view a specific set of hole attributes, depending on the preset selected. For information and steps on using this tool, refer to the Hole tabular view section of the hole page.
 Blast tabular view
The Blast Tabular View tool allows you to view the data of selected blasts. For information and steps on using this tool, refer to the Blast tabular view section of the blast page.
 Properties
The Properties tool allows you to view the spatial data of an object.
To view the properties of an object, follow these steps:
-
Select the data you wish to see the properties of either in the data explorer or the view window.
-
On the Home ribbon, from the Data group, select Properties. The report window will display any data that the object contains.
 Spatial measurements
The Spatial Measurements tool allows you to view the spatial measurements of a selection of data. Spatial measurements are a series of data points categorised by their x, y, z locations in space. You can import these measurements into BlastLogic (refer to Import Spatial Measurements as a CSV) to create surfaces or generate values for custom hole properties. Each spatial measurement contains numerical values for any number of custom properties.
To view spatial measurements, follow these steps:
-
On the Query ribbon, in the Data group, select
Spatial Measurements. The Spatial Measurements panel will appear.
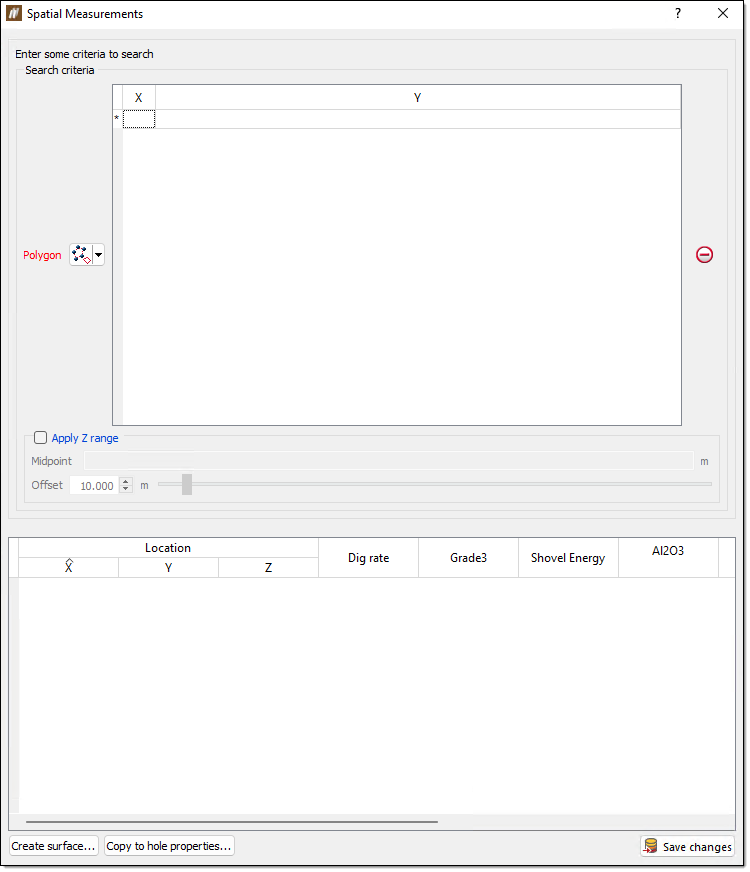
-
Define a search region polygon. Select one of the following options from the Polygon drop-down:
-
By points
The by points method involves drawing a polygon in the view window to specify the desired region. You can create a by points polygon by clicking around the area to be searched in the view window. BlastLogic records these points in the search criteria table. You can edit these points by altering the values in the table cells. -
By edge loop
The by edge loop method involves using an existing polygon to specify the desired region. You can either drag the polygon from the cad container in the data explorer to the Polygon field using the middle mouse button or enter the location using the following format /cad/<polygon name>. To create a polygon, refer to the Polygon section of the draw page.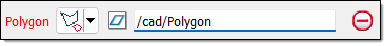
-
-
Optionally, you can limit the z range of the search by selecting Apply Z range. Enter the midpoint of the z range into the Midpoint field and define an offset using the Offset slider.
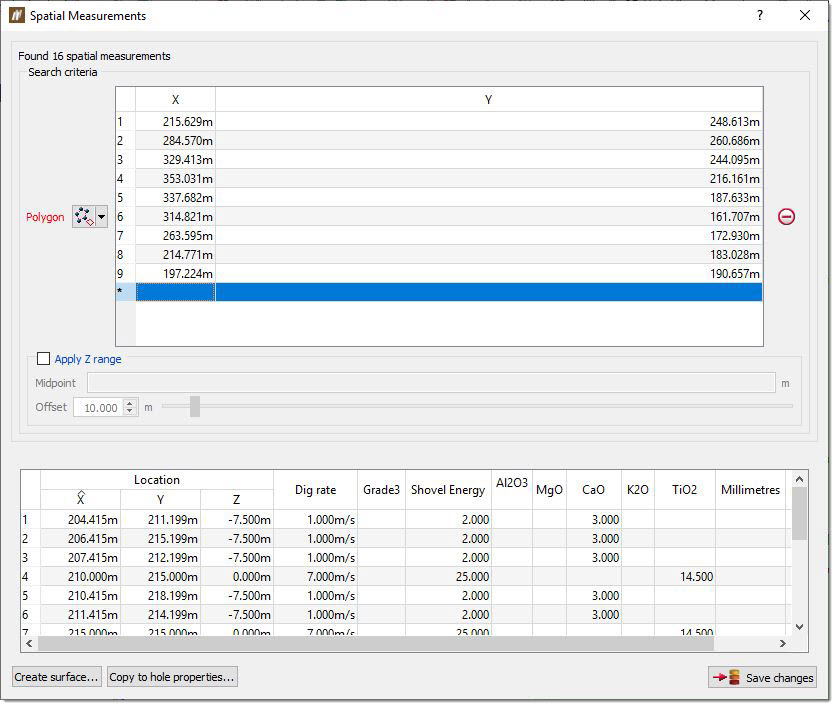
BlastLogic displays the spatial measurements which satisfy this criteria in the results table.
-
Optionally, you can edit this table and save your changes by clicking Save changes.
-
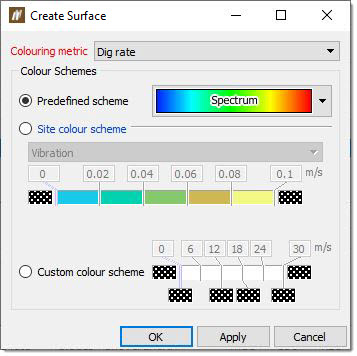
Optionally, click Create surface... to create a surface with a colouring metric based on a spatial measurement property.
-
Optionally, click Copy to hole properties... to allocate spatial properties to corresponding hole properties based on an inverse distance method.
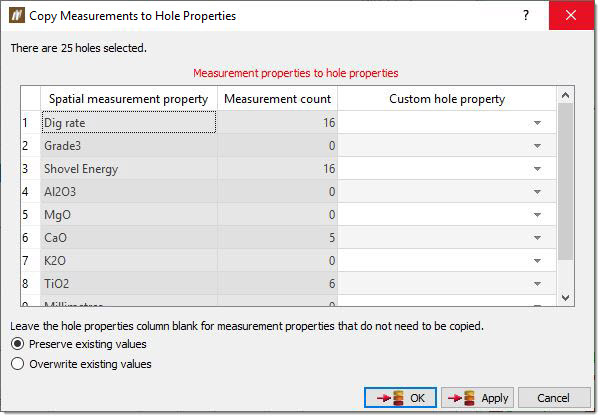
The table contains each of the spatial measurement properties for the given data set. You can also assign each of these properties to a custom hole property by following these steps:
-
Assign a custom hole property to a spatial measurement property using the drop-downs in the Custom hole property column.
-
Save your properties using one of the following methods:
-
Click Preserve existing values to only save custom hole properties to holes which do not already have a value.
-
Click Override existing values to save all custom hole properties to holes, regardless of existing values.
-
-
