Create a Vein Model
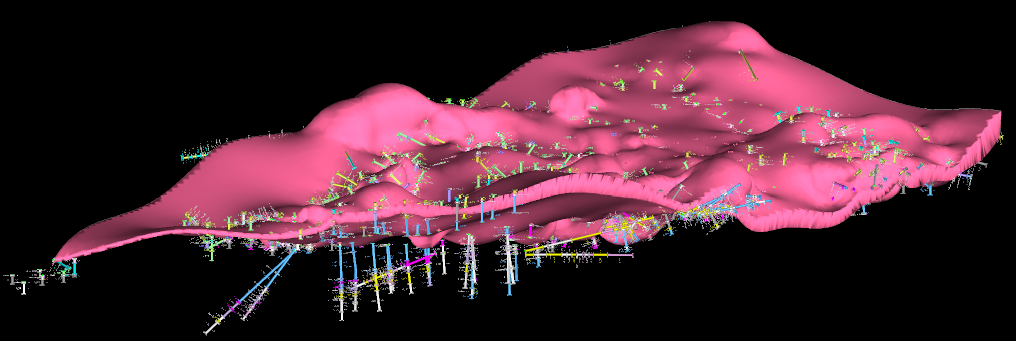
Vein modelling is a method of modelling stratigraphic horizons as continuous surfaces. The ![]() Vein Model tool can generate a continuous solid or set of surfaces representing the vein or stratigraphic horizon.
Vein Model tool can generate a continuous solid or set of surfaces representing the vein or stratigraphic horizon.
Follow these steps to create a vein model from your drillhole data:
-
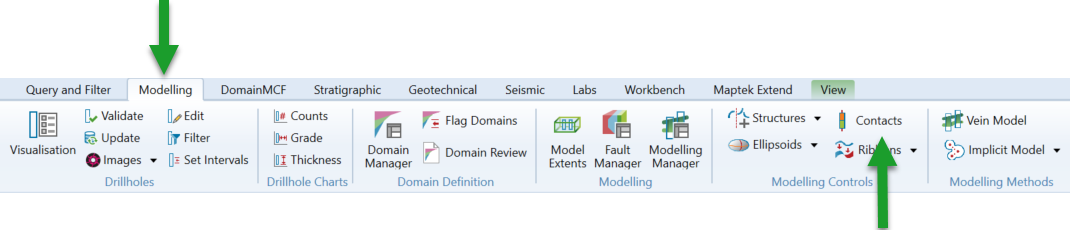
Launch the Vein Model tool.
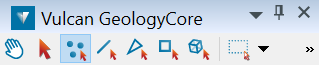
On the ribbon, navigate to Modelling > Modelling Methods >
 Vein Model.
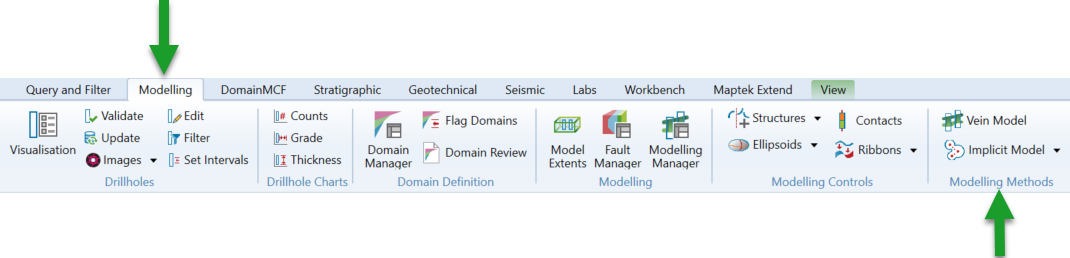
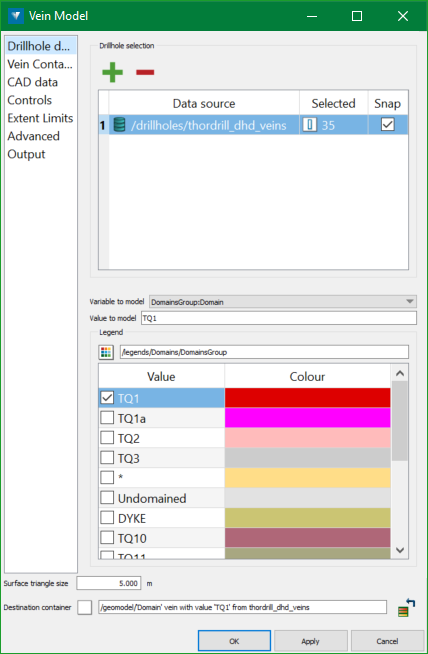
The Vein Model panel appears.
-
Supply the data to model.
The vein model tool will model a single vein from supplied source data. You can supply drillholes, CAD data, or both.
Supplying drillhole data
To supply drillholes as source data:
-
Switch to the Drillhole data tab if it is not already active.
-
In the Drillhole selection list, specify the set of drillholes to base the model on.

This field requires a drillhole selection from a single database.
-
Add a drillhole database
 or drillhole
  subset to the list by making a selection in the project explorer and then clicking
  . Alternatively, drag and drop the drillhole database or selection directly from the project explorer into the drillhole list.
-
Remove an item by selecting it in the list and clicking
 .
.
-
-
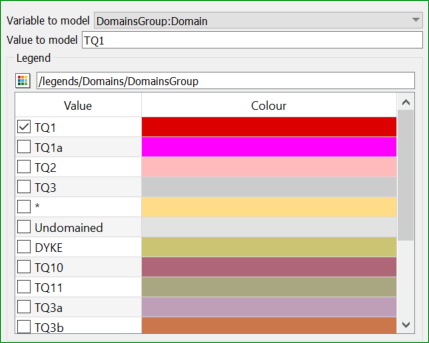
From the Variable to model drop-down, select the table and field for the variable you want model. To model your domains, select Intervals Table:Domain.
-
Specify the value you want to model. Either:
-
Type the name of the value in Value to model.
-
If there is a compatible legend for the variable you want to model, make sure it is specified under Legend. Then, select the checkbox for the value from the Horizon column.
-
-
-
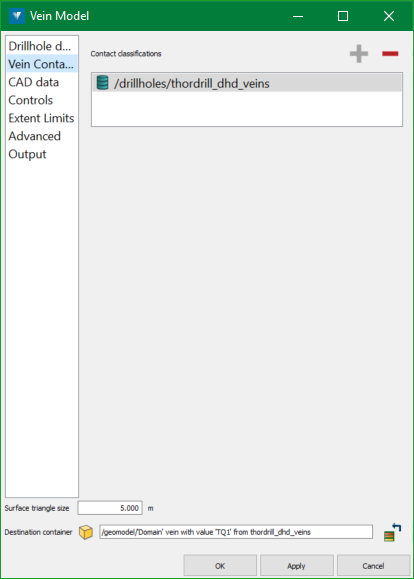
Add Vein contacts.
Vein Contacts database objects are optional output of the standalone Vein Modeller and optionally added as an input in the Vein Contacts panel. Vein Contacts database objects are automatically output and used in subsequent modelling runs when modelling a vein in the Modelling Manager.
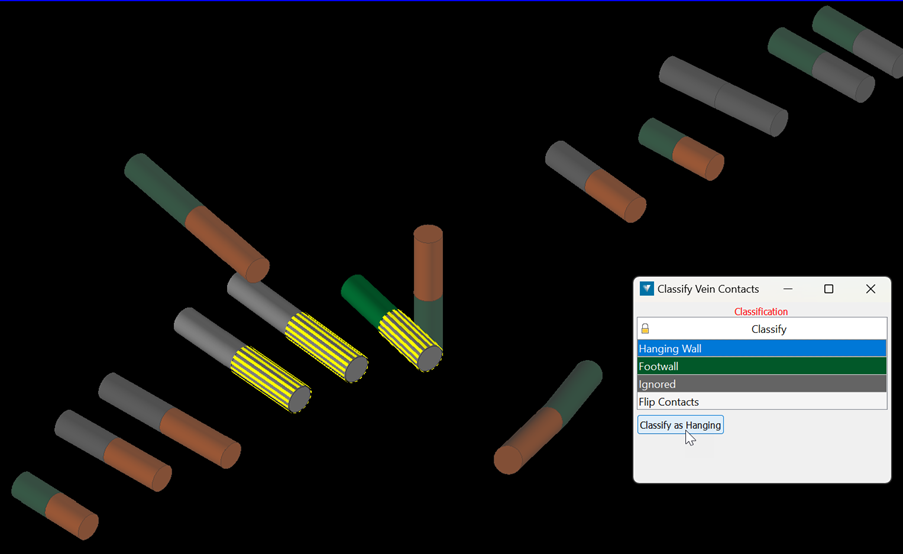
These databases only contain intervals of the domain being modelled. The domain intervals are split in half and classified, based on the orientation and Drillhole Ends settings as either Hanging Wall, Footwall, or Ignored.
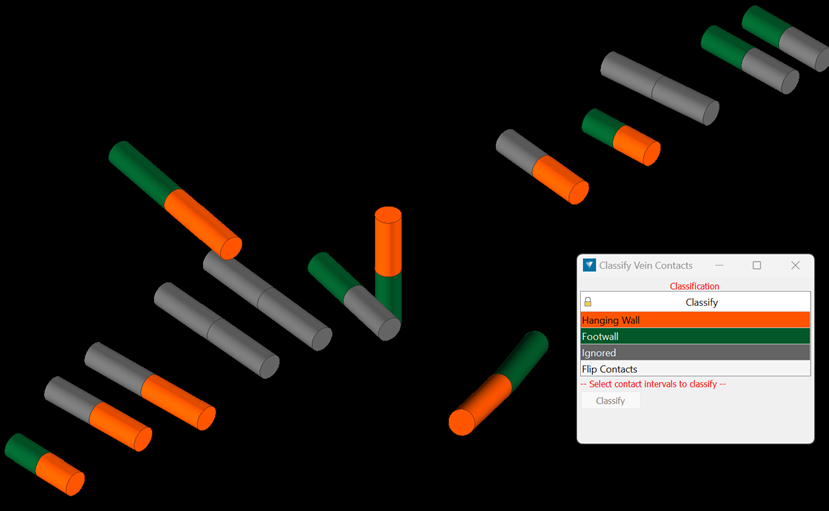
These automatically assigned classifications can easily be updated using the Modelling > Domain Modelling > Contacts tool.
-
Supplying CAD data.
You can supply CAD data representing hanging walls and footwalls. The CAD data can be any object containing points, such as point sets
 , lines
  , or polygons
  . Only the points extracted from these objects will contribute to the model.
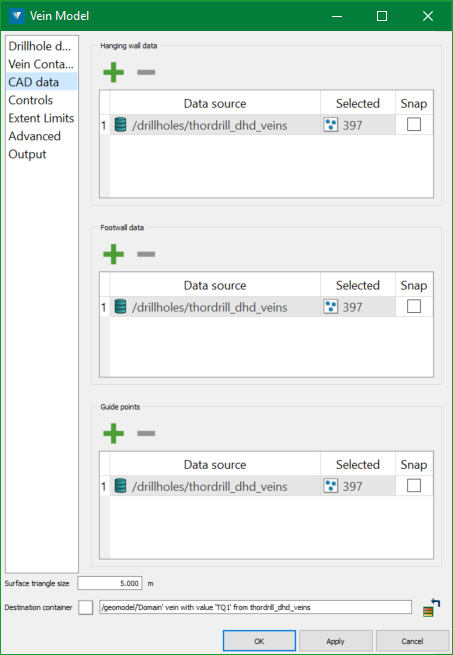
To supply CAD data:
-
Switch to the CAD data tab.
-
Under Hanging wall data, specify any number of objects representing the hanging wall.
-
Under Footwall data, specify any number of objects representing the footwall.
-
Under Guide points, specify any number of objects representing the midpoint generated guide surface.
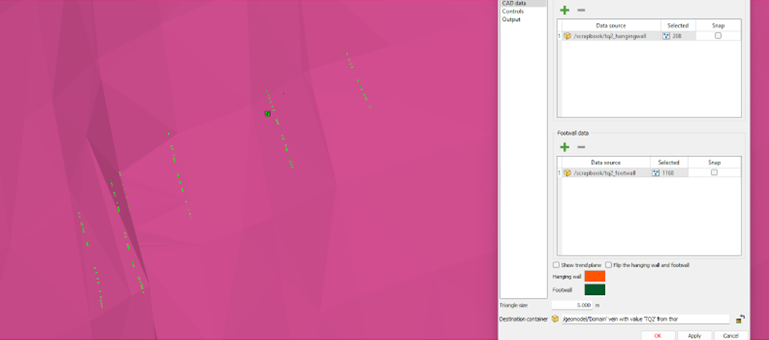
Snapping model
The model can be snapped to drillhole interval boundaries.
Separate hanging wall and footwall data can also be snapped to, although doing so should be done with caution, especially if these points have not been picked up by survey.
For example, if using hanging wall and footwall points collected from a digital mapping software, these could be best being used to guide the implicit model rather than being snapped to - especially if the points are at a much finer resolution than the triangle size being used in the implicit modeler.
Using the mapping points as a guide for the implicit modeler:
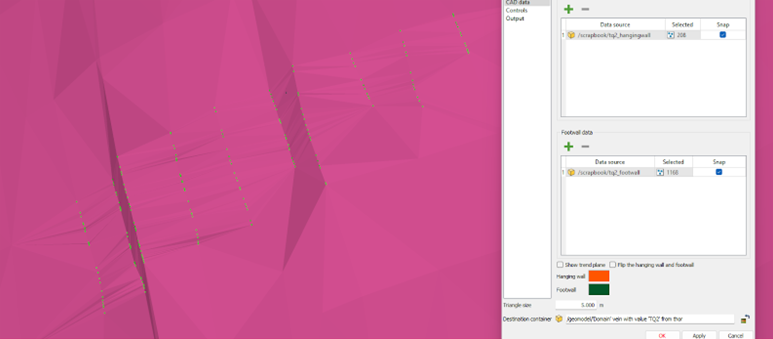
Using the mapping points to snap to:
-
-
Specify controls.
Additional controls are available to constrain the vein model in various ways.
To configure additional controls, switch to the Controls tab.
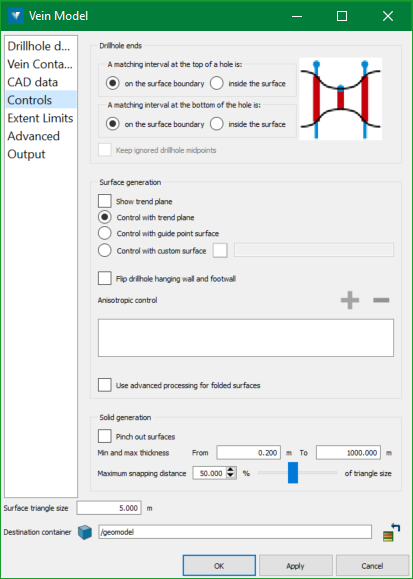
Drillhole ends
Under Drillhole ends, you can control the modelling behaviour where intervals of the target value occur at the top or the bottom of a drillhole. This is to account for cases where the drillhole data is incomplete, in which case you might like to ignore the interval.
Choose how to classify matching intervals occurring at the top or the bottom of the hole, either as:
-
on the surface boundary—i.e. make the model honour the interval.
-
inside the surface—i.e. ignore the interval.
The diagram on the right will update to indicate the effect of your choice.
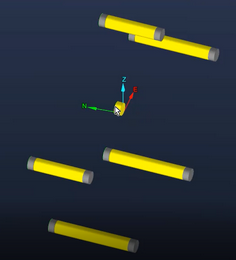
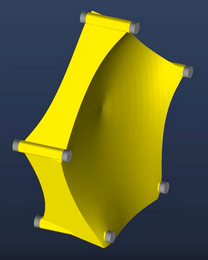
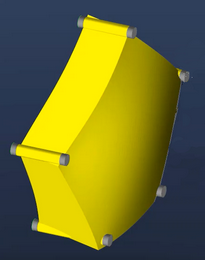
Consider the example below. The first frame shows several drillholes, with the target interval coloured yellow. The drillhole in the centre has a single, short interval which may be incomplete. The second frame shows the resulting model if the interval is specified as being on the surface boundary. The model pinches in to honour the data exactly. The third frame shows the resulting model if the interval is specified as being inside the surface, in which case it is ignored, and the surface is modelled on the trending drillhole intervals.
Keep ignored drillhole midpoints - This option allows midpoints of intervals excluded by the inside the surface option to still be used in the generation of the midpoint trend surface.
Surface generation
This section basically contains settings related to the control of the hanging wall and footwall surfaces.
Under Surface generation, the following controls can be utilised:
-
Show trend plane displays the calculated trend plane that fits the supplied modelling data, highlighting which side has been calculated to be the hanging wall and footwall.
-
Control with trend plane uses the calculated trend plane to determine the orientation of the projected control points used when modelling the hanging wall and footwall implicit surfaces.
-
Control with mid point surface uses the implicit surface modelled from the domain interval midpoints to determine the orientation of the projected control points used when modelling the hanging wall and footwall implicit surfaces.
-
Control with custom surface allows a custom user defined surface to be used to determine the orientation of the projected control points used when modelling the hanging wall and footwall implicit surfaces. This can be useful when trying to model recumbent folds.
-
Flip drillhole hanging wall and footwall flips the assigned hanging wall and footwall points auto calculated from the drillhole data. This has no impact on any hanging wall or footwall CAD data provided, this simply allows the hanging wall and footwall as auto calculated from the drilling data to be flipped if the auto calculated sides aren’t the desired way around.
-
Anisotropic control
Ellipsoids provide localised anisotropic control. Use them to orient the model along a structural trend, or to bridge gaps which may appear in sparse data.
In the Anisotropic control list, specify one or more ellipsoids
 . It is recommended that a few ellipsoids are used initially, adding more later only if required.Expand to see instructions on how to create an ellipsoid.
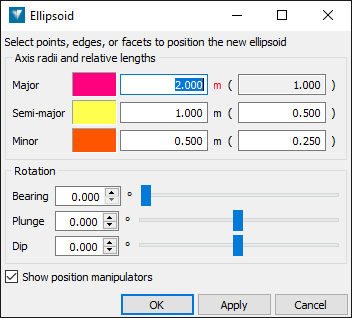
To create an ellipsoid:
-
On the ribbon, navigate to Modelling > Implicit Modelling >
 Ellipsoid.
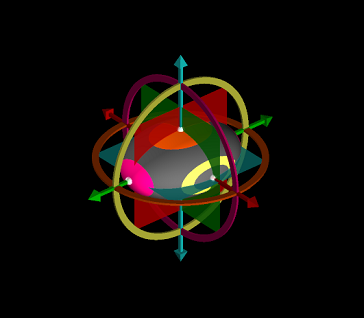
The Ellipsoid panel appears and an ellipsoid appears in the view at the centre of rotation.
-
Configure the ellipsoid by changing values in the panel, or by using the ellipsoid’s dynamic manipulators in the view.
Tip: Click and hold the middle mouse button on an ellipsoid manipulator or the ellipsoid itself to change the ellipsoid’s size, shape, or position.
-
Click OK or Apply to create the ellipsoid.
The ellipsoid
is created and saved into the geomodel standard container  .
.
See more detailed information about creating and editing ellipsoids in Ellipsoids.
-
-
Use advanced processing for folded surfaces allows multiple intervals of the same domain to be utilised within each drillhole, with the drillhole domain interval contact points being classified as hanging wall or footwall based on which side of the control surface they’re on. For the most effective result using this option the provided control surface needs to be a reasonable approximation of the mid surface.
Solid generation
This section contains settings related to the control of the final output vein solid.
Under Solid generation, the following controls can be utilised:
-
Pinch out surfaces will boolean the hanging wall and footwall surfaces when creating the solid. This will result in holes in the vein solid and processed hanging wall and footwall surfaces where the intermediate surfaces cross.
-
Min and max thickness allows minimum and maximum thickness values to be defined when the Pinch out surfaces option is not being used. When minimum and maximum thickness values are defined the processed hanging wall and footwall surfaces will be adjusted to ensure the minimum and maximum thickness values are maintained between the two surfaces. Definable range is >0.2m, with defaults set as 0.2m - 1,000m.
-
Maximum snapping distance determines the maximum distance the surface will be moved when snapping to input data points, as a percentage of the selected modelling triangle size. The definable range can be set from 10% to 100% of selected modelling triangle size. Default is set to 50% of the triangle size.
Note: In scenarios where snapping results in crossing surfaces and the Pinch out surfaces option are not being used, surfaces will still be booleaned out where they cross after the snapping pass to avoid creating crossing triangles. In this case, trying a smaller triangles modelling size, or perhaps some manual CAD data can be used to ensure the surfaces do not cross after snapping is applied.
-
-
Configure the extent limits.
Under Extent limits, you can configure the limits of the model in the XY plane.
To configure the extent limits, switch to the Extent Limits tab.
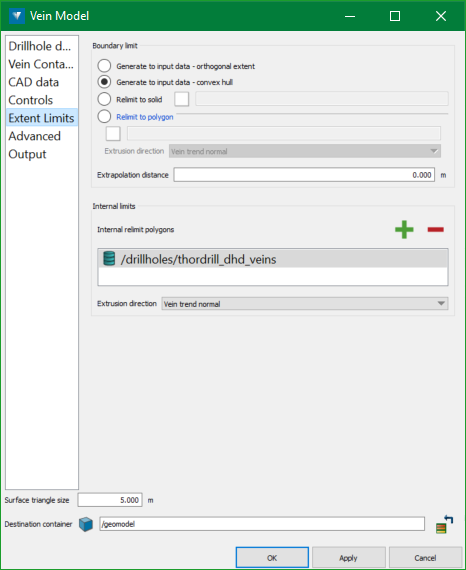
Boundary limit
-
Under Boundary limit, choose one of the following options:
-
Generate to input data - orthogonal extent—the model will extend laterally to fill a rectangular area aligned to the X and Y axes, roughly covering the orthogonal extent of the input data.
-
Generate to input data - convex hull—the model will extend laterally to the shape of a convex polygon fitting the input data in the XY plane.
-
Relimit to solid—the model will extend laterally to the shape of a custom solid in the XY plane.
-
Relimit to polygon—the model will be extend laterally to the shape of the supplied polygon in the XY plane.
-
Extrusion direction defines the direction to project the polygon when creating the extruded relimiting solid. Available options are:
-
Vein trend normal - the polygon will be extruded perpendicular to the trend plane of the vein data.
-
Polygon normal - the polygon will be extruded perpendicular to the best fit trend plane of the polygon.
-
Z axis normal - the polygon will be extruded perpendicular to the Z axis.
-
-
Extrapolation distance allows to extrapolate the model past the relimit constraints set above by the specified distance.
-
-
-
Extrapolation distance allows you to extrapolate the model past the relimit constraints set above by the specified distance.
Internal limits
Polygons can be selected to be used as internal relimiting regions too. This can be particularly useful if you do not want to use the Pinch out surfaces option, but want manual control over a region where a hole is to be created within the vein solid, such as surrounding barren drillholes.
Extrusion direction - defines the direction to project the polygons when creating the extruded relimiting solids. Available options are:
-
Vein trend normal - the polygons will be extruded perpendicular to the trend plane of the vein data.
-
Polygon normal - the polygons will be extruded perpendicular to the best fit trend plane of the polygon.
-
Z axis normal - the polygons will be extruded perpendicular to the Z axis.
-
-
Configure the advanced options.
To configure some advanced options, switch to the Advanced tab.
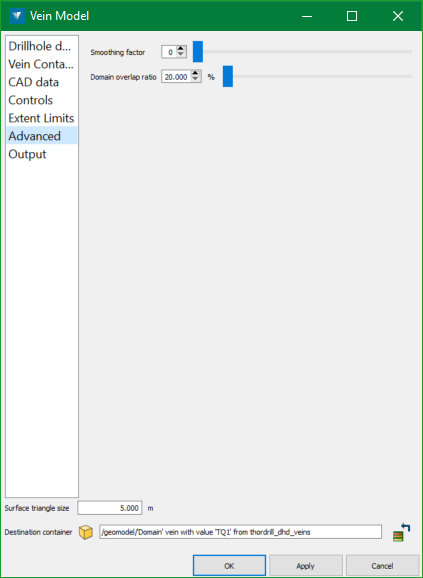
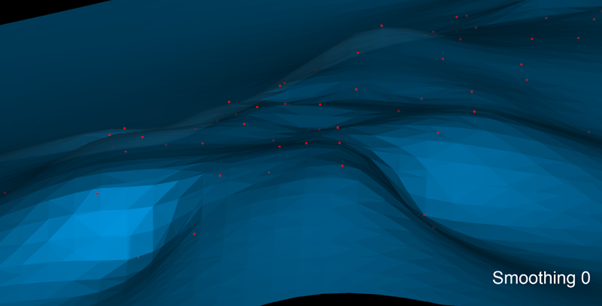
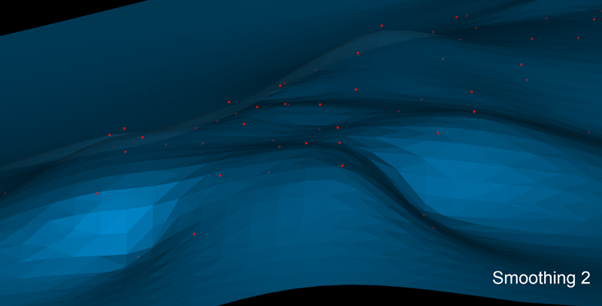
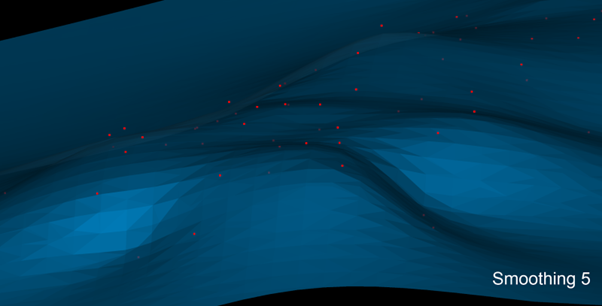
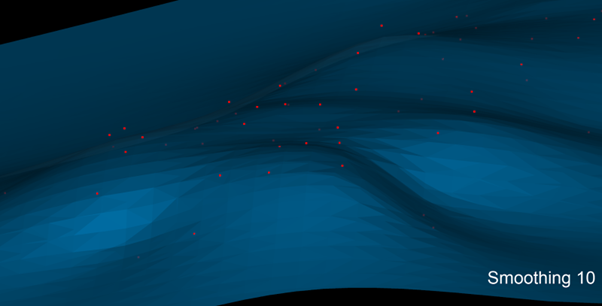
Smoothing factor
The RBF interpolant utilised within the Vein Modeller is a thin plate spline interpolant. Thin plate splines can be thought of as a bendable surface and have an inherent built in smoothing function. Increasing the Smoothing factorincreases the smoothness of the surface and reduces undulation between data points, but may cause some data points to be outside the resulting vein model as the surface may no longer honour the data points as closely. The default value is 0 (no smoothing).
Note: Smoothing is applied to the RBF implicit function, not the surfacing of that function - which is why data points may not be honoured when smoothing is applied. This also means it will affect all surfaces generated by the Vein Modeller.
Here are some example outputs of different smoothing factors:
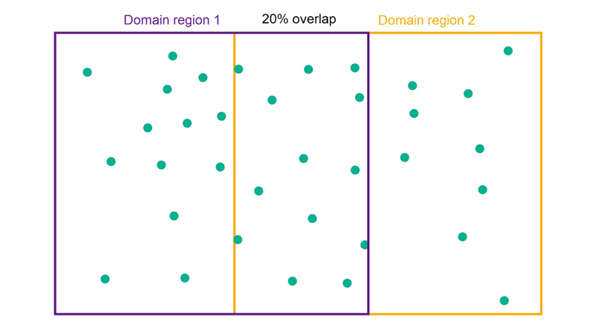
Domain overlap ratio
RBF interpolation is traditionally quite slow, so the Vulcan GeologyCore implicit modelling engine utilises what is called a partition of unity algorithm, which means the modelling region gets split up into smaller areas (domains), solves the implicit functions for each area independently, and then stitches the implicit models for each region back together before surfacing the final model.
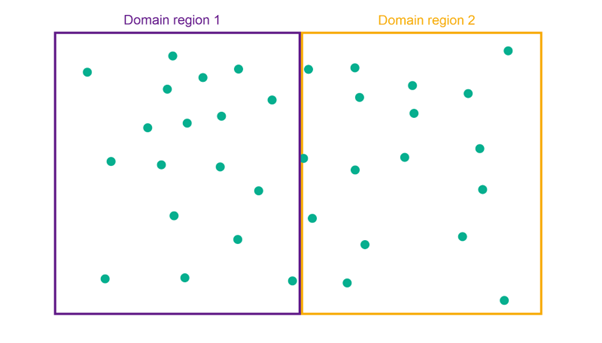
The Domain overlap ratio defines the amount of overlap in data used between each sub-region. A smaller overlap ratio is faster to process, but a larger overlap ratio will provide better continuity between the sub-regions.
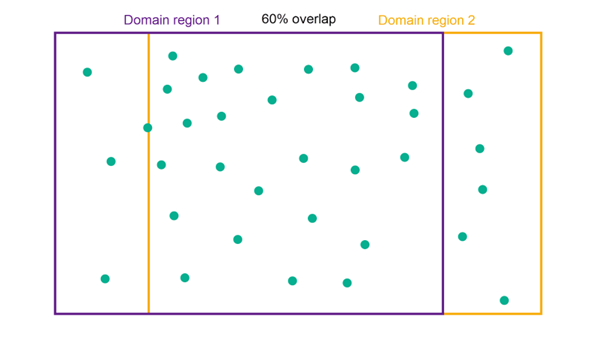
Note: If you find you’re getting what look like steps or kinks in a surface, especially towards the edge of the model, increasing the overlap ratio may lessen or mitigate these features.
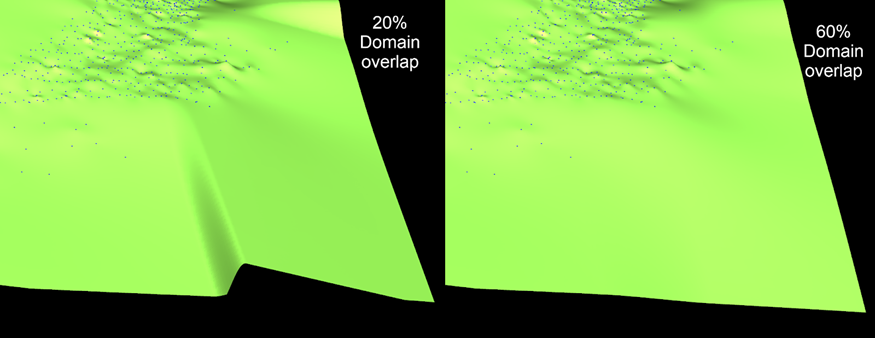
Note: Increasing the overlap ratio may provide a tidier result by reducing large artefacts, at the expense of longer modelling time. Even small increments will have a significant effect on modelling time. It is recommended that small changes are made first to compare the results.
-
Configure the output.
Configure which objects to generate on the Output tab:
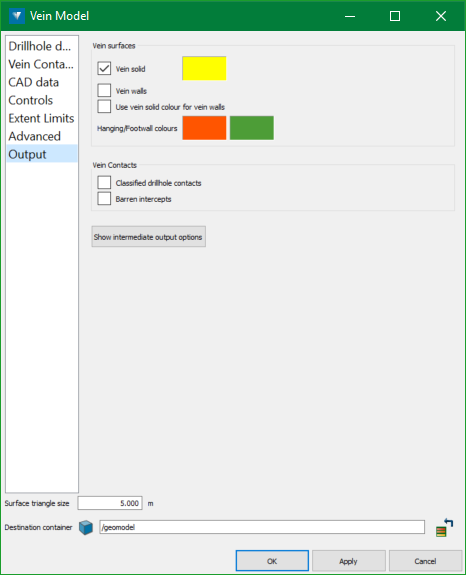
-
Vein surfaces
-
Vein solid—select this checkbox to generate a solid surface representation of the vein model created from the processed hanging wall and footwall surfaces.
-
Vein walls—select this checkbox to save the processed hanging wall and footwall surfaces that are used to create the vein solid.
-
Use vein solid colour for vein walls—select this checkbox to output the vein walls with the same colour as the vein solid.
-
-
Vein contacts
-
Classified drillhole contacts—choose to generate the contacts and wall classifications extracted from input drillholes. The classifications can be edited manually and used for future modelling.
-
Barren intercepts—choose to save the locations of the drillholes that did not contain the modelled domain as they intersect with the hanging wall and footwall surfaces. The barren intercepts can be used in future modelling to create holes in the vein surface.
-
Intermediate output options
-
Processed surfaces
-
Hanging and footwalls - select this checkbox to generate the hanging wall and footwall surfaces with the following applied:
-
Relimiting
-
Pinching out (if selected)
-
Minimum and maximum thickness processing (if not using the pinching out option)
-
Snapping
-
-
-
Raw surfaces
-
Hanging wall - select this checkbox to generate the hanging wall surface with no post-processing applied.
-
Footwall - select this checkbox to generate the footwall surface with no post-processing applied.
-
Control surface - select this checkbox to generate the surface from the mid points of the vein intervals.
Note: Since this surface is modelled first in the process and the hanging wall and footwall surfaces are each modelling independently afterwards, this mid point surface may not always sit exactly in between the hanging wall and footwall surface.
-
-
Data points—choose whether to generate point sets of the hanging wall, footwall and/or middle of the vein.
At the bottom of the panel, set Triangle size to change the maximum triangle size on any generated surfaces. A smaller triangle size will result in a higher resolution model that better conforms to thinner domains.
In the Destination container field, optionally change where the output is to be saved. The default destination is /geomodel.
-
-
Generate the Model.
Click OK or Apply to generate the vein model.
|
Create an Implicit Model
|