Interactive Cut Planner
Use this option to create scheduling cuts by interactively cutting bench solids into smaller blocks.
Instructions
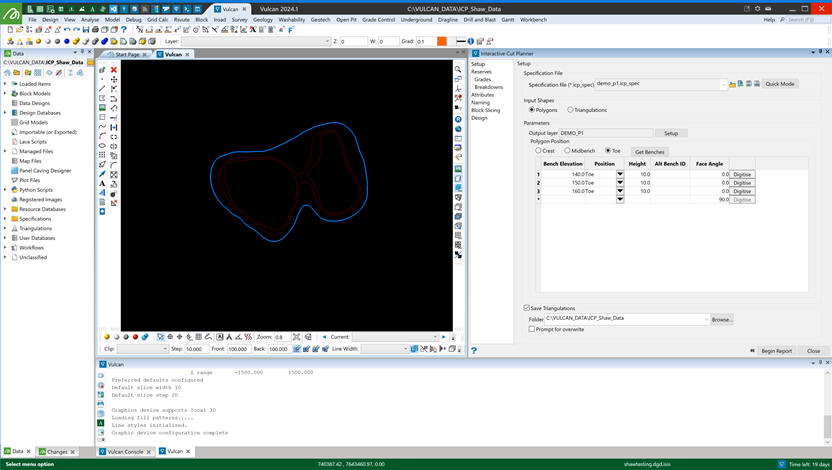
On the Open Pit menu, point to Open Cut Design , and then click Interactive Cut Planner .
The Interactive Cut Planner panel is persistent, meaning that you will be able to collapse the panel or use other options and controls without disrupting your session.
It is helpful to utilise the docking feature when using this option so you can view both the polygons and the Interactive Cut Planner side-by-side.
Setup
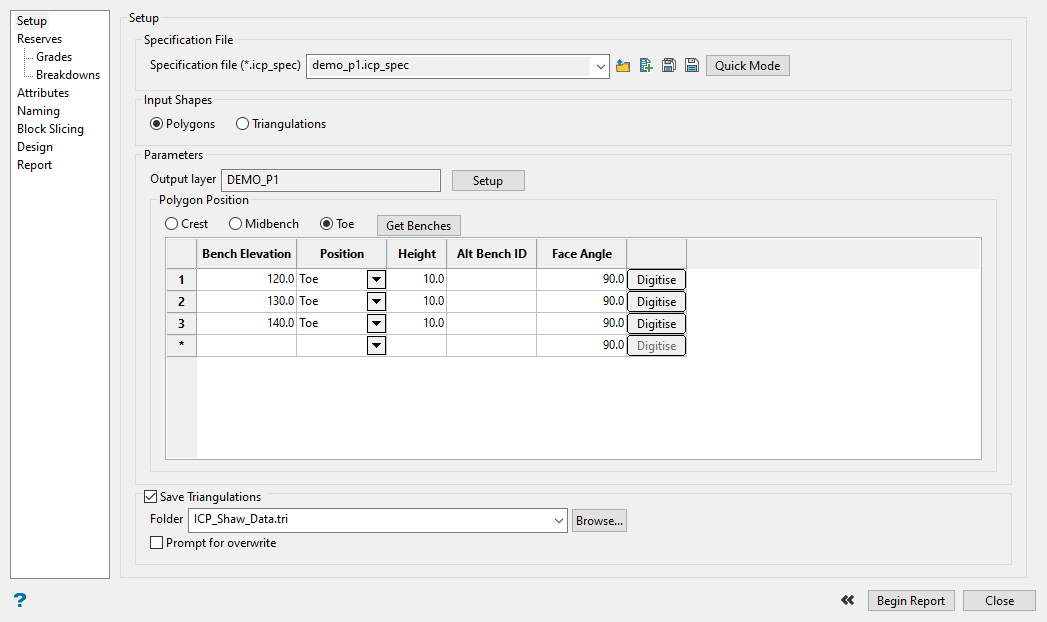
Use this pane to create a new specification file or load an existing one, define the polygons or triangulation solids you want to use as your input bench data, and set up where to store the resulting output.
Follow these steps:
-
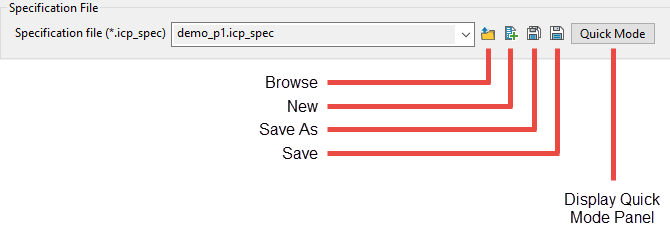
Select a specification file using the drop-down list.
Use the icons to browse for a specification file in a location other than your current working directory, creating a new specification file, or save one.
-
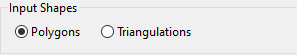
Select what you want to use for your Input Shapes . You can use either polygons or triangulations. The Parameters section of the interface will change depending on your selection.
 Polygons
-
Click the Setup button. The following panel will be displayed.
-
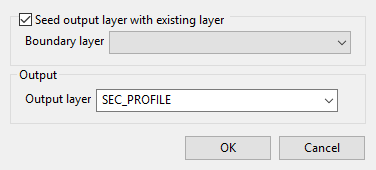
Select Seed output layer with existing layer if you want to copy an existing layer and use the copy as the boundary layer. Select the layer from the drop-down list.
-
Enter a name for the Output layer .
-
Click OK . A new layer will be created and will flag the objects in that layer as boundary objects.
Note: You can also seed with a single layer that contains multiple bench elevation polygons by repeating this process if you have more than one polygon that you want to use. After clicking OK , you will need to confirm either replacing the existing output layer or appending the new selection to it.
-
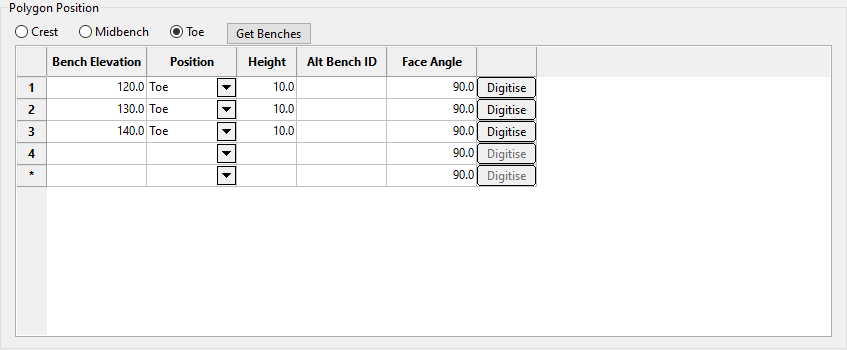
Select whether the polygons in the output layer represent the toe, midbench, or crest of the benches.
-
Click Get Benches to populate the table with all the objects in the new layer. The Interactive Cut Planner will automatically calculate the bench height of each polygon based on the vertical distance between the polygons.
Note: If you do not populate the table using the Get Benches button, you will need to fill it in one row at a time, then click the Digitise button to draw the bench polygon.
-
Bench Elevation - Enter the bench elevation.
-
Height - Enter the height of each bench.
-
Polygon Position - Select the position for the polygon level, whether it is the crest, midbench, or toe.
-
Alt Bench ID - (Optional) You may enter an alternative bench ID to access as a an attribute in a later step.
-
Face Angle - Enter the face angle to be used to angle the cut through the bench solid. By default, the cuts will be set at 90 degrees.
-
Triangulations
-
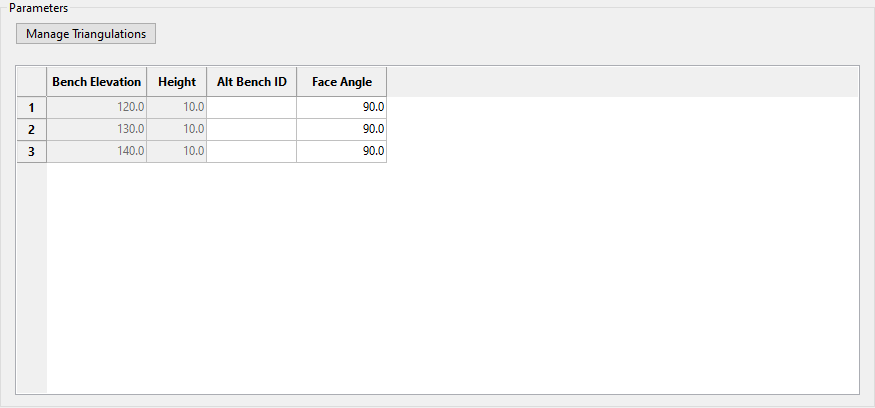
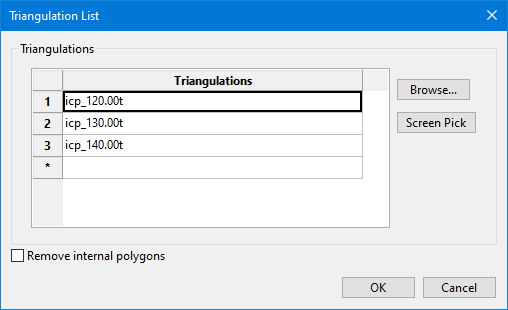
Select the boundary triangulations by clicking the Manage Triangulations button and using the panel to list all the triangulations you want to use. You can select them from a drop-down list in the table, click the Browse button to locate triangulations that are not found in the list, or click Screen Pick to select them from those already loaded into Vulcan.
-
Click Remove internal polygons to remove any internal polygons which may be mistaken for benches. This can happen when a triangulation is selected as the input object for one or more cuts, and the resulting polygons showing the boundaries for each of the cuts has not been removed before making another cut operation.
-
Click OK to return to the main panel.
-
The table will be populated with the triangulations you selected.
Bench Elevation - (Read only) This will display the bench elevation for the bench triangulation. When using a triangulation as your input shape, the bottom of the triangulation is automatically interpreted as the bench toe and the elevation will be read from there.
Height - (Read only) This will display the bench height. This comes from the thickness of the bench solid used as input.
Alt Bench ID - (Optional) You may enter an alternative bench ID.
Face Angle - Enter the face angle to be used to angle the cut through the bench solid. By default, the cuts will be set at 90 degrees.
-
-
Enter where you want to save the resulting cut solids. By default, a folder will be created automatically and given a name using the name of the specification file with the format (icp.ti\<spec name>.tri). You can replace this with a different folder name, or browse for an existing folder using the Browse button.
-
Click Prompt for overwrite to ensure a confirmation is given prior to overwriting an existing solid with a new one using the same name.
-
Continue to the Reserves tab.
Use Quick Mode to create cuts with the least amount of setup. Some of the features of Quick Mode include:
-
A specification file is not required.
-
Triangulations are selected directly instead of setting up benches.
-
Automatically uses the loaded block model.
-
Pre-selects the only loaded triangulation if one exists, or pre-selects the highlighted one if multiple loaded.
-
You can call this option by right-clicking on a triangulation.
-
Parameters set in the Quick Mode panel can be taken back to the original panel.
-
When confirming the cut, tonnage and grade information are displayed as labels, and are output to Vulcan's Report Window.
Follow these steps:
-
Click the Quick Mode button on the setup pane of the Interactive Cut Planner panel, or right-click on a loaded triangulation and select ICP quick mode. The following panel will be displayed.
-
Click the small, blue Screen Pick arrow next to the field labelled Triangulation .
If no triangulation is loaded, you will be prompted to select a polygon instead.
Note: If you opened the Quick Mode panel by right-clicking on a triangulation, this field will already be populated.
-
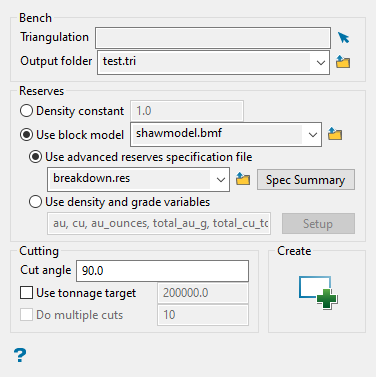
Select Density constant and enter the density value if you only want to calculate tonnages.
-
Select Use block model and select the block model from the drop-down list if you want to calculate both tonnages and reserves.
-
Select Use advanced reserves specification file if you have a (.res) spec file that you want to apply. You can preview the parameters of the spec file by clicking the Spec Summary button.
-
Select Use density and grade variables to setup customised calculations using the Variables panel.
-
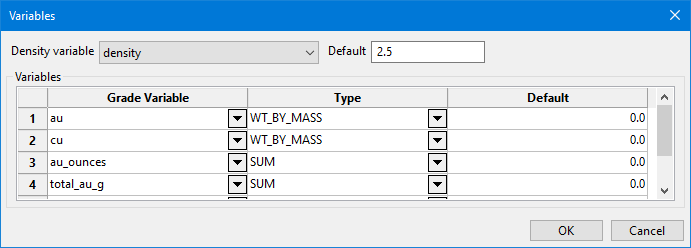
Select the Density variable from the drop-down list. This list contains the variables defined in your selected block model.
-
Enter a Default value for the density that will be used in cases where the block model variable is not defined.
-
Select one or more Grade variables from the block model.
-
Select the Type of calculation that you want to apply to each variable.
Wt by Mass Used for grade variables that should be treated as a weighted average based on mass (For example, grams per tonne of gold). Wt by Vol Used for grade variables containing values based on volume weighted average (For example, grams of gold per cubic metre). Sum Used for variables containing units (For example, grams of gold) that should be cumulated rather than averaged.
-
Enter a Default value that will be used if the block variable is not estimated.
-
Click OK to return to the Quick Mode panel.
-
-
Enter the angle of cut into the field labelled Cut angle. By default, it will be set at 90 degrees.
-
Select Use tonnage target if you want Vulcan to adjust your cut line automatically to create a block that gives the required tonnage entered in the tonnage target field.
-
Indicate the number of cuts you want to create using the tonnage target.
Note: This field will be disabled if Use tonnage target is not selected.
-
Click the Create Cuts icon to make your cuts.
-
Reserves
Use this pane to define how you want to run the calculations. You can define them by setting the parameters up within the Interactive Cut Planner or use a pre-existing Advanced Reverses specification file.
Follow these steps:
-
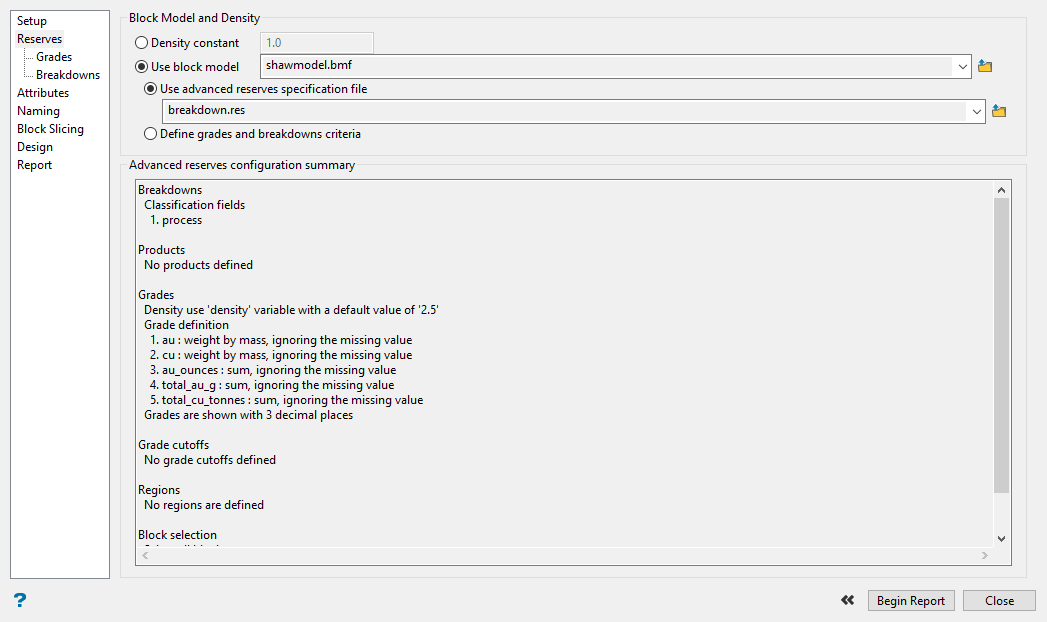
Select whether to use a density constant or to use the density from the block model when calculating tonnages.
To use a block model, select the model from the list or browse for it by clicking the Browse icon on the right.
-
Select how you want to set up your reserve calculations. The reserves can be calculated in one of two ways.
-
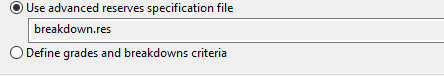
Use advanced reserves specification file - This method allows you to import a specification file that has been created using the Advanced Reserves Editor .
If you select to use an existing advanced reserves specification file, the basic configuration will be displayed in the summary window.
-
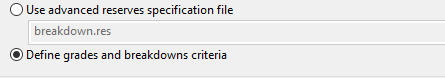
Define grades and breakdown criteria - With this method you can define the grade variables, types, and default values by using the table found on the Grades pane
Note: If this is not selected then the table on the Grades pane will be disabled.
Tip: This option is useful if you have a lot of variables to reserve. The (.res) file will already have the variables selected along with the variable types, saving you the time it would take to set up the criteria again.
-
-
If you chose to define the grades and breakdown criteria, click the Grades tab to continue.
If you are using an existing Advanced Reserves specification file, click the Attributes tab to continue.
Grades
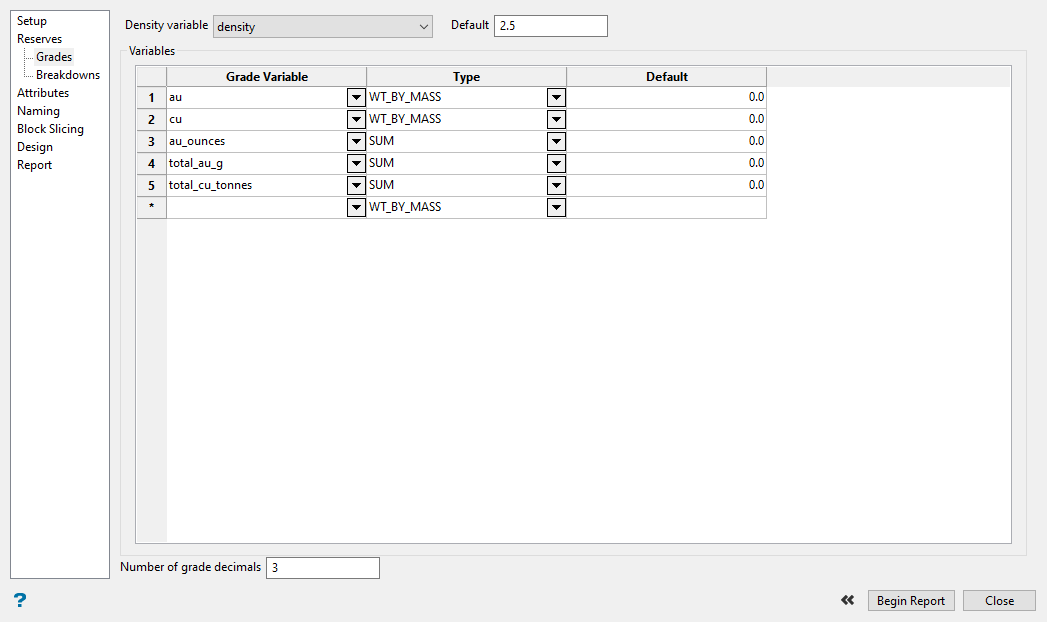
Use this pane to set up the density and grade variables that you want to evaluate.
Follow these steps:
-
Select the Density variable from the drop-down list. This list contains the variables defined in your selected block model.
-
Enter a Default value for the density that will be used in cases where the block model variable is not defined.
-
Select one or more Grade variables from the block model.
-
Select the Type of calculation that you want to apply each variable.
-
Wt by Mass - used for grade variables that should be treated as a weighted average based on mass (For example, grams per tonne of gold).
-
Wt by Vol - used for grade variables containing values based on volume weighted average (For example, grams of gold per cubic metre).
-
Sum - used for variables containing units (For example, grams of gold) that should be cumulated rather than averaged.
-
-
Enter a Default value that will be used if the block variable is not estimated.
-
Enter the Number of decimals to use in the space provide just under the table on the left side.
-
Click the Breakdowns tab to continue.
Breakdowns
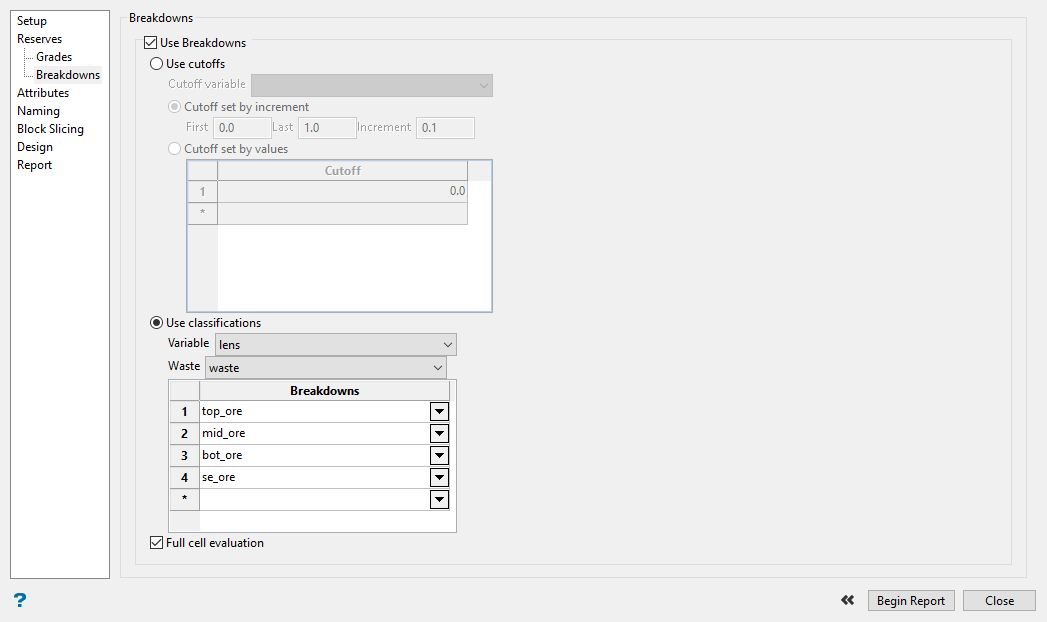
Using this pane is optional. It is used to set up how you want to breakdown the report. You can use a series of cutoffs, or set up a classification scheme such as reporting by geology, ore type, etc.
Follow these steps:
-
Select Use Breakdowns to report grade values by cutoffs or classifications.
-
Select Use cutoffs to use cutoff values in the report.
-
Select the Cutoff variable from the drop-down list.
-
Select either Cutoff set by increment or Cutoff set by values .
Cutoff set by increment - Use this to select a range between the First and Last values, and then set the number of steps between the two.
First : 0.0, Last : 1.0, Increment : 0.1,
would result in cutoff values of [0.0, 0.1, 0.2, 0.3....0.9, 1.0].
Cutoff set by values - Enter your own custom cutoff values into the table.
Note: You can only use one or the other, Breakdown or Cutoff. If there is a need for both, you will need to use an Advanced Reserves specification file as described earlier
-
-
Select Use classifications to define a breakdown variable so reserves can be broken down according to a field, such as GEOLOGY or ORE_TYPE with the grades reported for each of the values (classes) specified.
-
Select the breakdown Variable from the drop-down list.
-
Select the value of the classification variable that represents Waste . This list will be populated based on the values for the breakdown variable found in the block model.
-
-
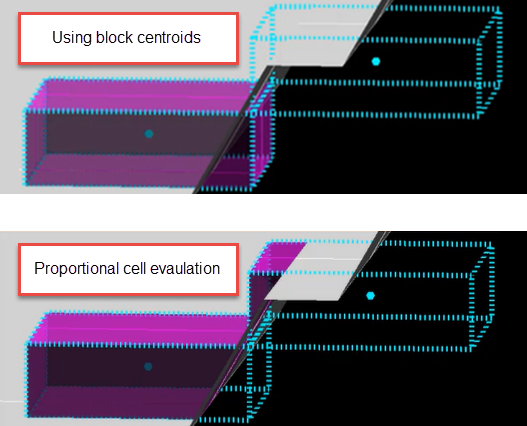
Select Full Cell Evaluation to report values taking the entire block into consideration rather than just the portion that is within the solid.
Note: As this selects those blocks with centroids inside the solid, the results reported may not be precise so a warning will be given to ensure that you want to use this option.
By default, the evaluation method is set to Proportional cell evaluation .
-
Click the Attributes tab to continue.
Attributes
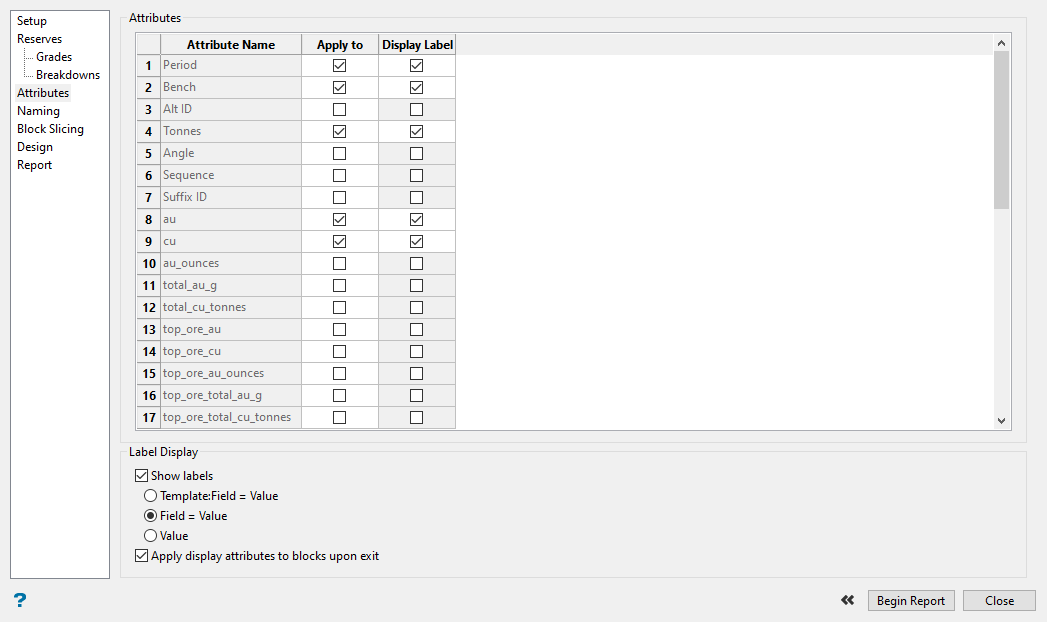
Use this pane to select the attributes associated with your resulting output polygons or solids. The attributes you select can used as labels displaying information about each cut.
Follow these steps:
-
Select the attributes that you want to track you want from the table.
The first column, Attribute Name , shows the attributes available to you. The contents of the list will differ depending on which option you selected on the Reserves tab.
NoteIf you choose Use advanced reserves specification file , the Attribute Name field will depend on what you have in the (.res) file (Products, Breakdowns, Cutoffs and Grades.)
If you choose Define grades and breakdowns , the Attribute Name field will be limited to Grades, and either Breakdowns or Cutoffs (since you cannot select both).
-
Select the attribute by clicking the checkbox in the Apply to column. The value will be written to the solid or polygon.
-
Display the attribute as a label by clicking the checkbox in the Display Label column. The label will be displayed beside the solid or polygon while the Interactive Cut Planner is in use.
NoteThe option Display Label will have an effect only if the Show labels option is checked.
-
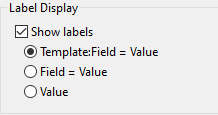
Select Show labels if you want to see the labels displayed beside the solid or polygon. You will need to chose one of the available formats.
Template:Field = Value ICP:Bench = 140.000Field = Value Bench = 140.000Value 140.000
-
Select Apply display attributes to block upon exit to generate a permanent text object in your output layer that matches the label that displays while making cuts if you have also elected to display labels while in the tool. If it is not enabled, the attributes are stored as object value, but a text label is not generate on exit of the Interactive Cut Planner.
-
Click the Naming tab to continue.
Naming
Use this pane to set up your naming preferences.
Follow these steps:
-
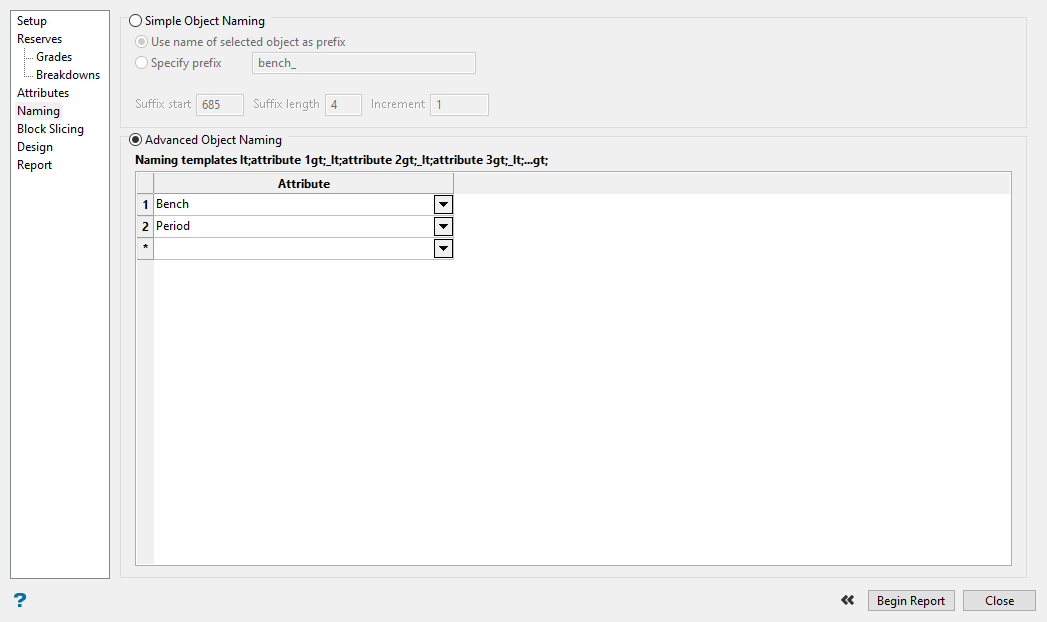
Select either Simple Object Naming or Advanced Object Naming .
Simple Object Naming
-
Select Use name of selected object as prefix to use the name of the object as the prefix instead of a custom name.
-
Select Specify prefix to enter a custom name as the prefix.
-
Enter the starting number into Suffix start to indicate the starting number of the sequence.
-
Enter the minimum number of digits required for the sequence number in the Suffix length box. This number must be an integer that is greater than or equal to 1.
-
Enter the step size in the Increment box.
Prefix:
preStarting sequence number:
1Step size of sequence number:
3Minimum identifier length: 4
Result:
pre_0001.00t,pre_0004.00t,pre_0007.00t,pre_0010.00t
Advanced Object Naming
This option allows you create a name based on selected templated attributes.
-
Use the drop-down list to select the attributes you want to include in the name. You may select more than one attribute.
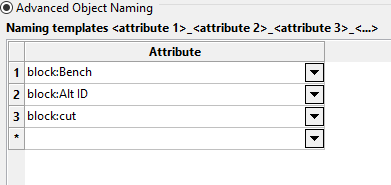
Result:
F05_1880_301.00t,F05_1880_302_1.00t,F05_1880_304.00t
-
-
Click the Block Slicing tab to continue.
Block Slicing
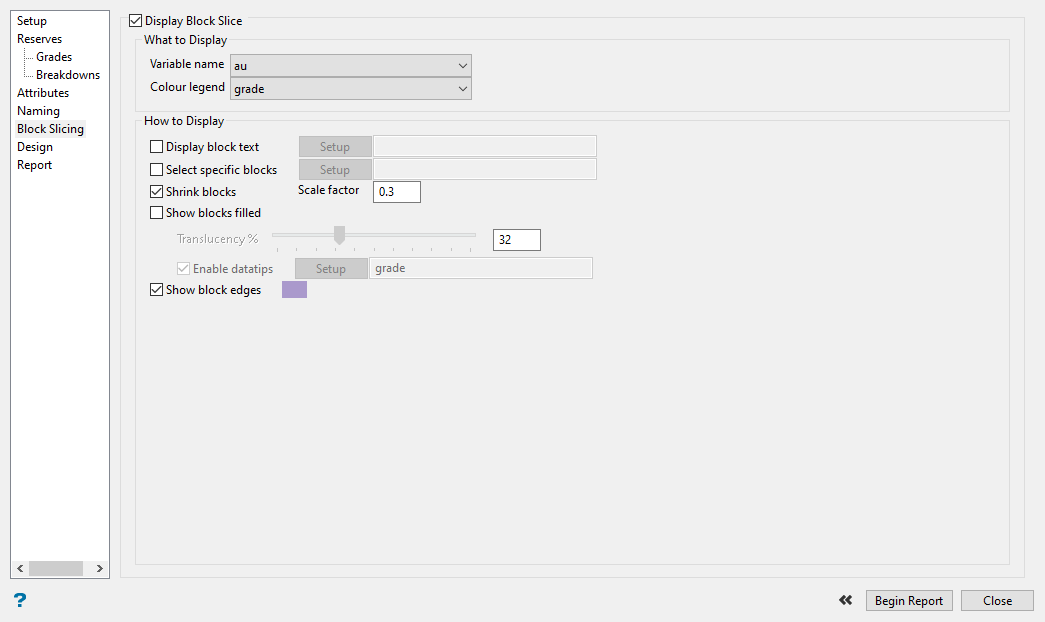
Use this pane to display block slices from the current bench. This can be helpful when digitising polygons for different pit cuts.
Follow these steps:
-
Select Display Block Slice at the top of the pane to enable the options.
-
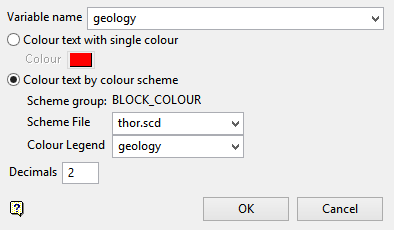
Select the block model variable from the Variable name drop-down list.
-
Select the Colour legend to use with the variable.
-
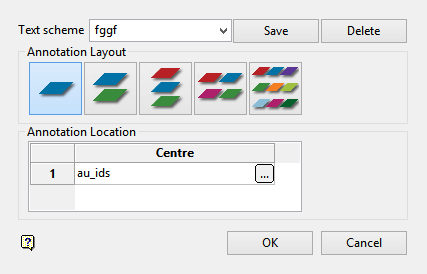
Select Display block text and then click the Setup button. This will open the Block Text dialog panel.
-
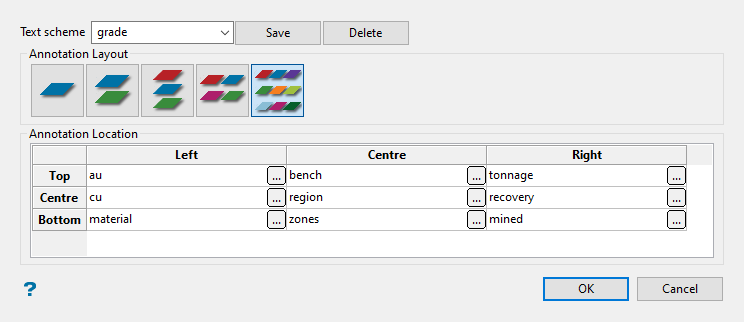
Type a name for the Text scheme in the space provided and click the Save button.
-
Select one of the five Annotation Layout options. This will provide you with up to nine different values to display in each block.

As you click on each of the icons, the Annotation Location display window will reflect the change in layout.
-
Click on the small
 button on the right of each cell to display the
Block Model Variable Annotation
panel.
button on the right of each cell to display the
Block Model Variable Annotation
panel.
-
Select the Variable name you wish to display from the drop-down list.
-
Select the colour scheme you want to use to display the information. For static information such as block size, a single colour works well. However, for variables with dynamic ranges such as ore grades or rock types a colour scheme works well.
-
Set the number of Decimals to use with numeric variables.
-
Click OK .
-
-
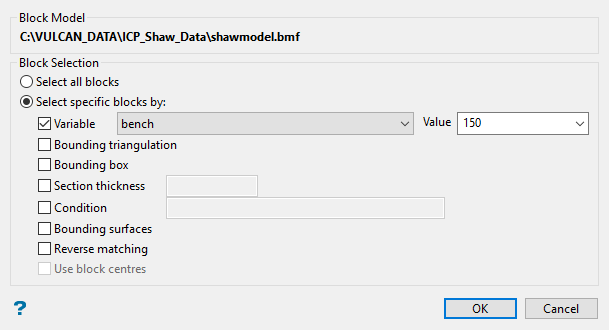
Enable Select specific blocks to define which blocks will be displayed. Clicking the Setup button will open the Block Selection dialog window.
-
Choose either Select all blocks or Select specific blocks by . If you select Select specific blocks by , then you must enter one or more of the following selection criteria:
Variable
Select this check box to restrict the blocks by a block model variable. You will need to specify the variable, as well as a particular value.
To restrict blocks to those where Material equals Ore, select 'Material' as the variable (from the drop-down list) and enter 'Ore' as the value. However, if you require all blocks that do not have this specified value, then enable the Reverse matching check box. The block model variable may be numeric (for example the grade variable 'Au') or character (for example 'Geology') variables.
Bounding triangulation
Select this check box to restrict the blocks by a triangulation. This is useful when, for example, you want to evaluate reserves within a particular solid triangulation such as a stope.
To select blocks outside of the bounding triangulation, select the Select blocks outside the solid only option.
You may also select the Use block centres check box and use it with this restriction.
This option is not applicable to open or 2D triangulations.
Bounding box
Select this check box to restrict the blocks by a box. The bounding box is defined in Interactive or Coordinate mode. The required mode is selected from the Box Thickness panel, which is displayed once the Block Selection panel has been completed. You may also select the Use block centres check box and use it with this restriction.
Section thickness
Select this check box to restrict the blocks by a section plane. You will need to enter its associated thickness. The blocks that are within this thickness will be selected.
The section plane can be selected by line, points, or grid coordinates. This information is entered through the Section Plane panel, which is displayed once the Block Selection panel has been completed. You may also select the Use block centres check box and use it with this restriction.
Condition
Select this check box to use a further constraint upon a numeric block model variable, for example Fe GT 10.0 (iron value greater than 10.0). The maximum size of the condition is 132 alphanumeric characters. A list of available operators/functions to use when defining this condition is provided in Appendix B of the Vulcan Core documentation.
Bounding surfaces
Select this check box to restrict the blocks by bounding surfaces. Once the Block Selection panel has been completed, you will be required to select (from the screen) the top and bottom surface triangulations. Only blocks that lie within the overlapping sections, as viewed in plan view, of the surfaces are selected. You may also select the Use block centres check box and use it with this restriction. This check box will be disabled when the Cut and fill surfaces check box is in use.
Reverse matching
Select this check box to select outside the specified regions. See the description of the Variable field. This check box will be disabled when the Cut and fill surfaces check box is in use.
This check box is only available when using the Advanced Reserves Editor, or when limiting the block selection by a bounding box, triangulation or surfaces.
Use block centres
Select this check box if you want to use the full cell evaluation method. If this check box is not selected, then the proportional cell evaluation method will be used instead.
-
Full cell evaluation - Include blocks if the block centroid is within the region. The entire block will be included.
-
Proportional cell evaluation - Include those blocks that touch the region and evaluate reserves according to the proportion of the block's volume that lies within the region. Proportional cell evaluation calculates and reports the exact proportion of a block within a solid triangulation. When selecting blocks, all blocks that touch the region are selected.
-
-
Click OK .
-
-
Select Shrink blocks to shrink the block markers, ensuring that the edges do not overlap. If this check box is enabled, then you will need to specify a scale factor. This value, which must be between 0 and 1, is entered as a fraction of the block dimensions.
-
Select Show blocks filled to shade each block within the block model.
-
Use the Translucency slider to control the amount of translucency. A value of 0 means the blocks are opaque, while a value of 100 means the blocks are invisible.
-
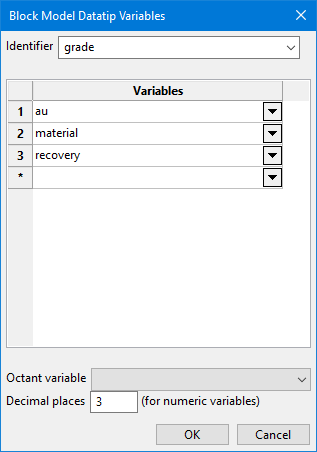
Select Enable datatips to open a sub-panel allowing you to set up information that displays when hovering your mouse over a block in section view.
-
Enter a unique name to use as an Identifier . Each identifier you create will act as a specification file that will save all the settings on this panel.
-
Select the Variables to display in the datatip.
-
If you have set up an Octant variable and wish to display its value, select it from the drop-down list.
-
Enter the number of Decimal places to use for numeric variables.
-
Click OK to return to the main panel.
-
-
Select Show block edges to show individual block extents. Extents will be shown in the colour you choose.
-
Click the Design tab to continue.
Design
Use this pane to define how your cuts will be made. You can make single cuts based on digitising a line by hand, cuts based on tonnage, and make a series of multiple cuts automatically based on distance or tonnage. You can also perform interactive modifications to existing cuts lines.
For the basic requirements needed to create a single cut, follow these steps:
-
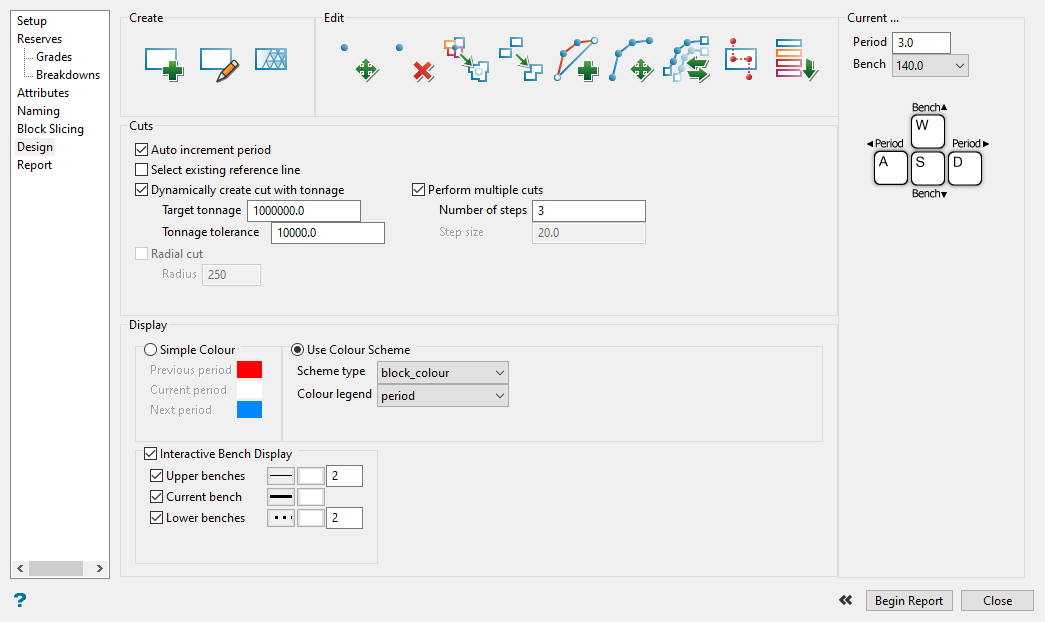
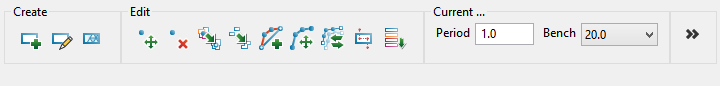
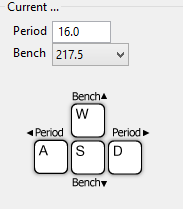
Set the period by entering a number into the space labelled Period in the upper right corner of the Design pane.
Note: You can also automatically increment the period each time a cut is made by selecting Auto increment period in the Cuts section of this pane.
-
Select the bench you want to work with from the drop-down list labelled Bench . All of the output layers you created in the Parameters section on the Setup tab will be listed by bench elevation.
Note: This will also determine which block slice you will see if you decide to use that option.
-
Click the Create Cuts icon at the top of the pane to digitise a line showing where to cut the bench.
TipIf the Interactive Cut Planner panel is blocking the view of your workspace, you can click on the double arrow at the bottom left of the pane to transform the Design Window into a compact editing menu.
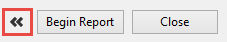
Click the double arrow on the compact panel to restore the panel back to full size.
-
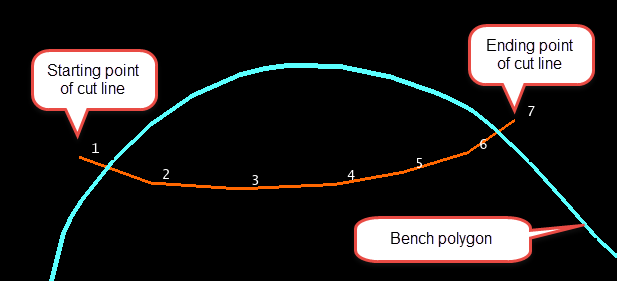
Digitise a line indicating where you want to make your cut. Make sure the starting and ending points are outside of the bench polygon. The line can have as many points as you need.
-
Select the side of the cutting surface to use when making your cut. Two polygons will be created, one showing the area between the last cut and the cut line, and the other showing the remainder of the bench.
-
Confirm which polygon you want to keep.
-
Right-click to cancel the operation.
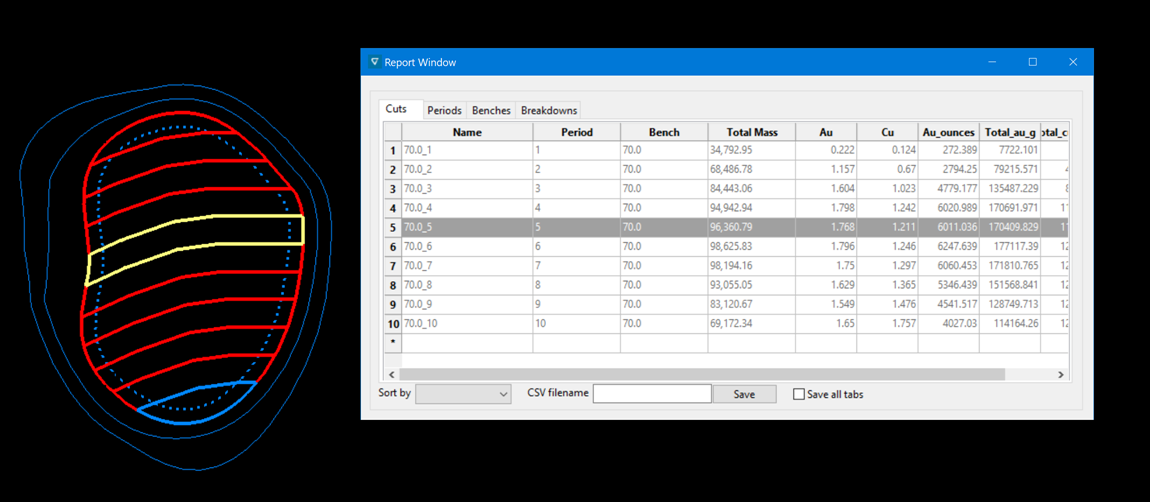
As each cut block is created, it is immediately reconciled against a block model (if you are looking at grades instead of just density.) The cut's reserves are added to a reserve total of all the current cuts, and compared against a target reserve. If the target is not reached, then the cut can be interactively modified and re-included in the reserve total until it is satisfactory. A sequence of cuts from several benches can be designed in this manner. The cut reserves are displayed in the Report Window of Vulcan.
Tools to create or edit the cuts
| Create tools | |
|---|---|

|
Create Cuts Use this option to create cuts, or sections, in a bench. Bisect a section of the bench by digitising a line. Then choose which side of the line will become the new block. |

|
Digitise Cuts Use this option to create a cut inside of a bench. The polygon is digitised fully inside of the bench. |

|
Blocks to Triangulations Use this option to create triangulations from the cuts. Click on the cut you want to convert into a triangulation. The new triangulation will not replace the cut. The original cut and polygon will still exist. |
| Edit tools | |
|---|---|

|
Move Point Use this option to edit the string making up the polygon. Click on the string nearest to the point you want to edit. Right-click to exit the function. |

|
Delete Point Use this option to delete a point in the string making up the polygon. Click on the string nearest the point you want to delete. Right-click to exit the function. |

|
Merge Point
Use this option to merge points. Points can be on separate strings. This technique can be used to merge smaller cuts together into a larger one. |

|
Merge Blocks
Use this option to merge cuts together. Cuts must be touching for them to merge together. |

|
Insert Points Use this option to insert points in a string. Right-click to exit the function. |

|
Move Segment Use this option to move a section of a string instead of a single point. A section is defined as the segment between two points. Right-click to exit the function. |

|
Replace String
Use this option to redo a section of string. Select a beginning point, an ending point, then redigitise the segment between the two points. |

|
Partition
Use this option to divide the cut up into separate sections by bisecting the cut with strings. You can create as many partitions as you want before exiting the function. Right-click to exit the function. |

|
Assign Period
Use this option to select a cut or bench to a certain period. Begin by selecting the period you wish to assign a cut to. Then click the Assign Period button. Next, click the cut(s) you want assigned to that period. When you have finished with your selection, right-click to exit the function. |
Options to automate your tasks
Use the options found in the Cuts section of the pane to automate some of your tasks.
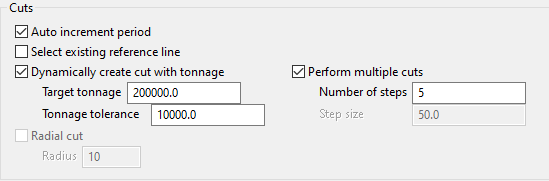
Auto increment period - Select this option if you want Vulcan to automatically increment the period each time you create a cut.
Select existing reference line - Select this option to select an existing reference line rather than digitising a line by hand.
Dynamically create cut with tonnage - Select this option if you want Vulcan to adjust your cut line automatically to create a cut that gives the required tonnage entered in the Target tonnage field.
-
Target tonnage - Enter the target tonnage.
-
Tonnage tolerance - Enter the tonnage tolerance. Cuts in this tolerance from the Target Tonnage value will be selected when dynamically searching.
Perform multiple cuts - Select this option to perform more than one cut automatically. Digitise a string representing the face that extends from one boundary to another. Then select the side of the string you wish to keep. Finally, indicate the direction in which you want to make the additional cuts. As each section is transformed into a cut you will need to confirm that you want to retain it.
-
Number of steps - Indicate the number of cuts you want to create.
-
Step size - Indicate the distance between each step.
Radial Cut - Use this option to apply a radius to the cut line. After clicking the Create Cuts icon, click the location on the screen where you want the centre of the radius to be. A polygon will be displayed showing the results. You will be prompted to either accept the polygon or cancel and try another location.
Navigating Benches and Periods
When in digitise mode for creating or editing cut polygons, you can control the period and bench elevation by using keyboard shortcuts.
Note: While using the Interactive Cut Planner, you will not be able to adjust your screen colour by using the A hotkey because it will be used by this option.
|

|
Increase bench elevation. |

|
Decrease bench elevation. |
|

|
Decrease period. |
|

|
Increase period. |
Display Options
The display options enhance the visualisation of the cut polygons. They can be very helpful, especially when working with multiple cuts and on more than one bench.
These three options are dynamic, meaning that the appearance of the cuts and benches will change as you enable each option.
Note: The colour scheme of a cut solid is not dynamic. Once a cut solid has been created, its colour will not change if a different display option has been selected.
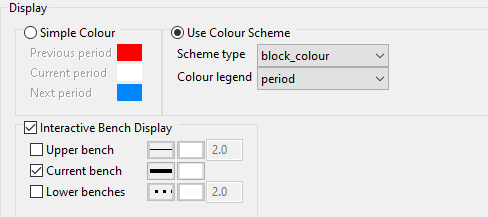
Simple Colour - Select this option to apply a basic colour scheme. The cuts will be divided into the previous periods, the current period, and the next period. You can select a different colour for each one by clicking on the colour icons. All cut solids will be coloured white. You will be able to edit the colour of the solids after you exit the digitise mode.
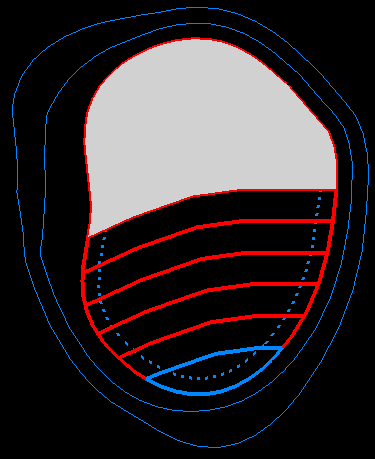
Figure 1 : Simple Colour
Use colour scheme - Select this option to display the periods using a chosen colour legend . You can create a numeric legend using a block scheme, contour scheme, drill scheme, geotech scheme, reserve scheme, or samples scheme. Each period and resulting solid will be assigned a different colour.

Figure 2 : Using colour scheme
Interactive bench display - Select this option to define how different bench levels are viewed. You can set the line style, fill pattern of the bench polygons, and the number of upper and lower benches that are visible.
Note: The number of upper and lower benches to view will be limited by the number of bench elevations defined in the Parameters table on the Setup tab .
Report
Follow these steps:
-
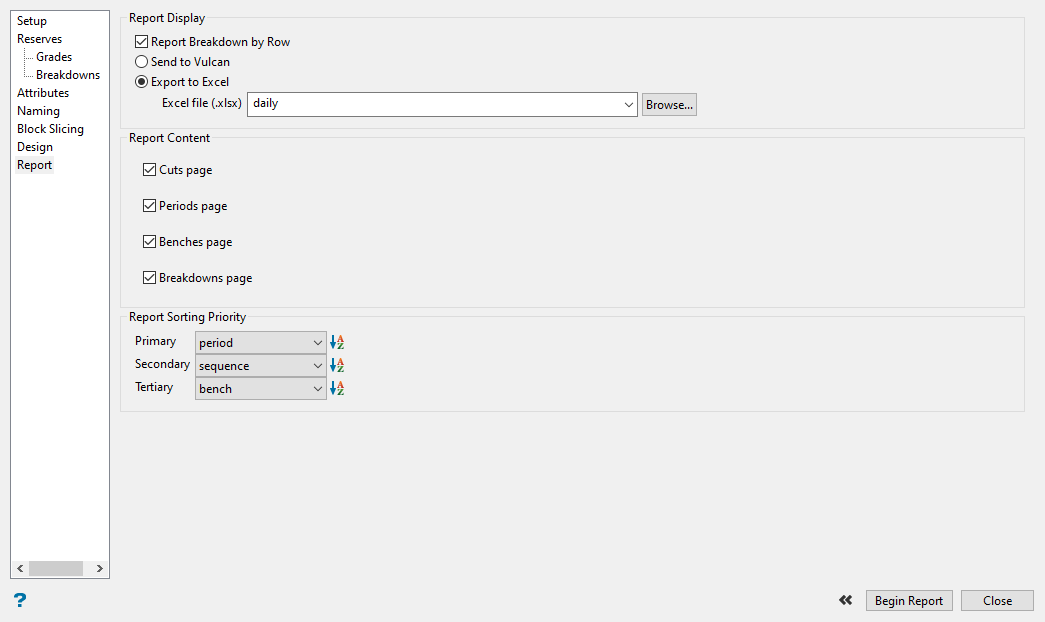
Click Report Breakdown by Row to organise the display of the breakdowns by row instead of by column. The results can be viewed on the Breakdowns tab of the report window, or by the Breakdowns sheet in the Excel spreadsheet file.
-
Select Send to Vulcan or Export to Excel . This will allow you to view the report in a Vulcan Report Window or in an Excel spreadsheet.
-
Select the Report Content options you want to see in the report.
-
Select the Report Sorting Priority by using the drop-down lists, then clicking the icon to the right of each list to arrange the content in either ascending or descending order.
-
Click the Begin Report button to display the results.
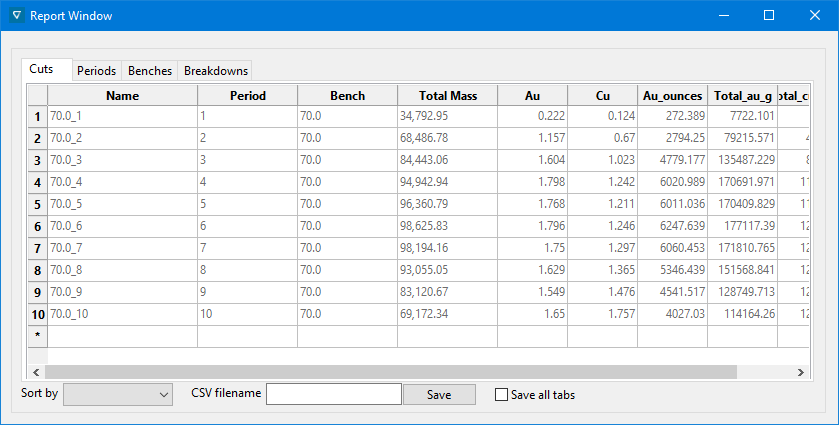
The Blocks Report Window is interactively connected to the polygon blocks that have been created on the bench. By clicking on any of the rows in the table within the Blocks Report Window, the corresponding block will be highlighted in the Vulcan workspace. Similarly, by clicking on any block that has been created, the corresponding row in the Blocks Report Window will be highlighted.