Workbench Utilities
Utilities are small tools integrated into Workbench that play a supporting role in your application use.
Explorers
Explorers allow you to access your data. Workbench provides a generic data explorer connected to your data folder. In addition, many applications will have their own project explorer. Consult your application’s help for more information on its project explorer.
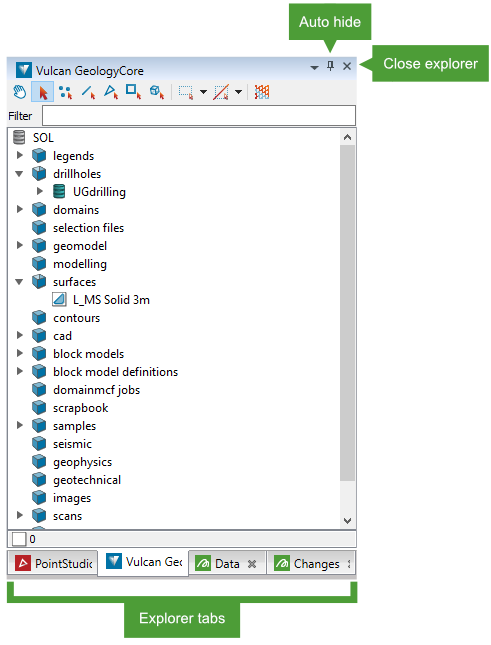
Showing, hiding, and closing explorers
Explorers relevant to an application are typically shown when you launch the application.
Tip: Explorer windows are just like other document windows. Drag an explorer window’s tab or title bar to float the window or dock it to another location. See Working with Applications > Working with Document Windows for more information.
-
Switch between the explorers for open applications by clicking the tabs in the explorer window area. Clicking on a non-active application’s tab will activate that application.
-
Click the
 (Auto Hide) button located in the top-right corner of an explorer to auto-hide explorers. Auto-hidden explorers are minimised to a series of tabs.
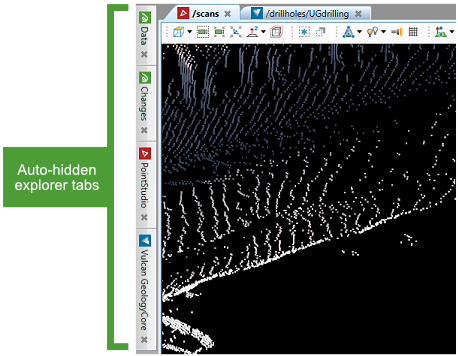
-
Hover over a tab to temporarily show the hidden explorer. The explorer will show until you click on another part of the screen.
-
Toggle the
 (Auto Hide) button on an explorer window when it is showing to turn auto-hide off.
 -
To show or hide all explorers, on the Workbench ribbon, in the Utilities group, toggle the
 Explorers button.
-
-
To re-open an explorer that you’ve closed, on the Workbench ribbon, in the Utilities group, click
 Show All Explorers.
Data explorer
The data explorer is a view onto your data folder. It is designed to work in particular with Vulcan, but can also be used in its own right. The data explorer groups files based on file extension. These groupings are referred to as virtual folders. The types of folders and the files they contain are easily identified by icons. Any directories that contain subdirectories, such as the Triangulations and Grids directories, will have the subdirectories displayed at the top of the list.
Tip: You can include files from locations other than the data folder by adding custom paths in your Workbench data preferences. See Configuring Preferences > Data for more information.
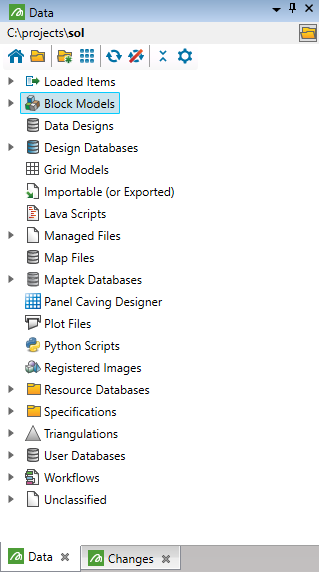
The path of the current data folder is displayed at the top of the explorer.
-
Click the
 button to the right of the data folder path to change the data folder.
The data folder has the following toolbar buttons:
|
|
Open Start Page |
|
|
Open the data folder in Windows File Explorer |
|
|
Open the data folder in Windows File Explorer with the selected files highlighted |
|
|
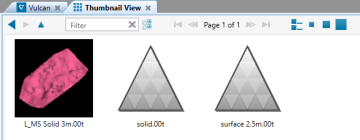
Open thumbnail view Display the group selected in the data explorer as an icon palette or detailed list. Items are represented by either their icons or thumbnails and can be viewed in multiple ways from a details list to large card view. Items can be dragged into other windows just as they can from the explorer. The dynamic filter can be used to quickly find assets with names containing the entered text. Large sets of items are paged to improve performance.
|
|
|
Refresh the data explorer (Alt+F5) This is helpful when used to resynchronise the view when there are multiple users, and when inactivity has occurred. Note this option may affect data explorer performance when updating large data changes. |
|
|
Suspend file-level updates to the data explorer Toggle on to prevent changes to files being reflected in the data explorer. |
|
|
Collapse All |
|
|
Data explorer preferences |

See also: Working with Applications > Setting the data folder
Logs
Logs are records of events in Workbench and your applications. Many applications also display small text reports or console windows for certain operations. Workbench displays these windows in the logs area.
Showing and hiding logs
Log windows are shown when required. A report window is typically shown after an operation in an application to show a summary or result.
Tip: Log windows are just like other document windows. Drag a log window’s tab or title bar to float the window or dock it to another location. See Working with Applications > Working with Document Windows for more information.
-
Click the
(Auto Hide) button located in the top-right corner of a log window to auto-hide log windows. Auto-hidden log windows are minimised to a series of tabs.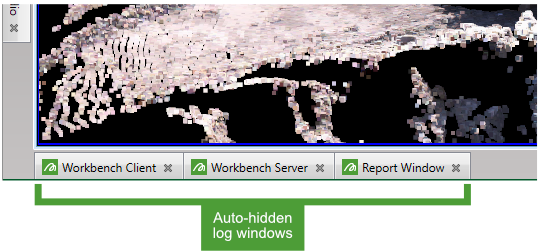
-
Hover over a tab to temporarily show the hidden log window. The log window will show until you click on another part of the screen.
-
Toggle the
(Auto Hide) button on a log window when it is showing to turn auto-hide off. -
To show or hide all logs, on the Workbench ribbon, in the Utilities group, toggle the
 Logs button.
-
-
To re-open a log that you’ve closed, on the Workbench ribbon, in the Utilities group, click
 Show All Logs.
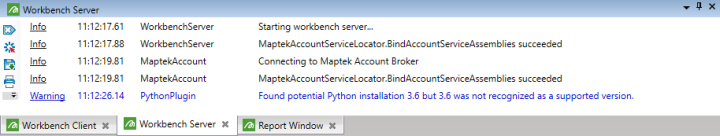
Workbench log windows
Workbench has the following two log windows:
-
Workbench Server displays events related to the Workbench application itself.
-
Workbench Client displays events related to Workbench client applications, that is, applications or plugins.
These logs have the following tools and commands available, both on the toolbar on the left and also in the context menu:
|
|
Clear Log Remove all entries from the log. |
|
|
Toggle Selection (all or none) |
|
|
Save As... (all or selected) Save the entire log or selected entries to a text file. |
|
|
Print... (all or selected) |
|
|
Copy Selected |
|
|
Send to Text Editor (all or selected) |
|
|
Send to CSV Editor (all or selected) |
|
|
Send Selected to Request Support Opens the Request Support tool with the selected log entries entered as the description. |
|
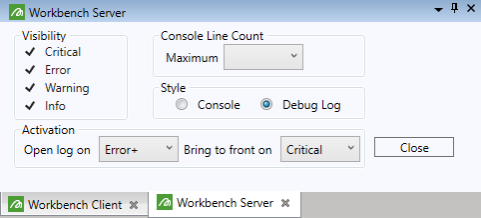
|
Options Configure the log. The following panel will display:
Configure the following aspects of the log:
|

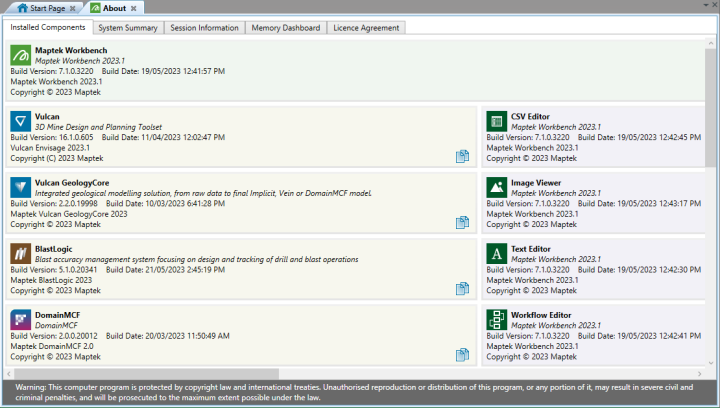
About page
The About page displays information about Workbench, your installed applications and components, system and session information, memory usage, and the Maptek Workbench Software End User Licence Agreement.
You can access the About page in the following ways:
-
On the
 Start Page, click About in the title area.
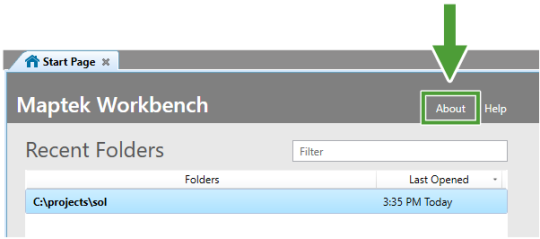
-
Go to Help >
 About.
