Interface Overview
Source file: interface-overview.htm
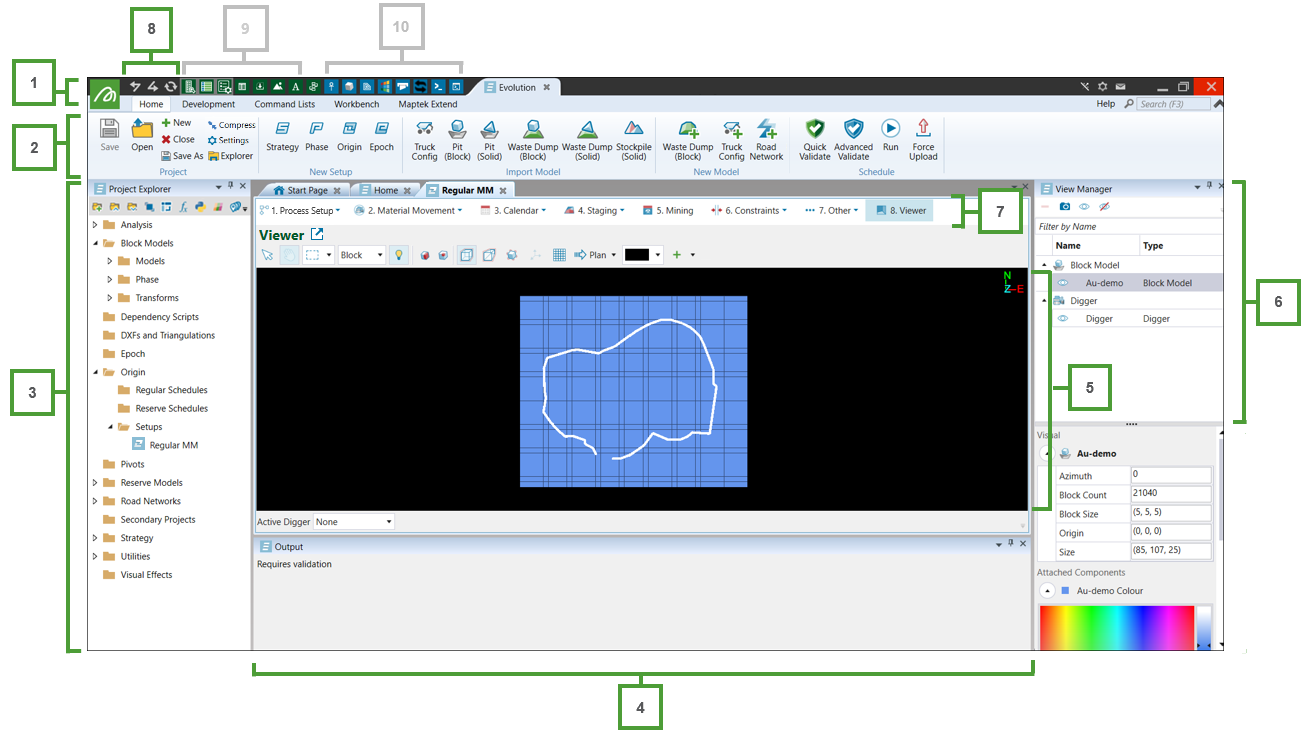
Evolution stores models, setups, and schedules in a single environment called a project. In a typical project, the display consists of the following elements when a setup is open.
Note: The image below shows the default screen when you open the ![]() Viewer tab in the Material Movement setup in Origin Blocks. The screen components differ depending on the scheduling module and the setup type that you have currently open.
Viewer tab in the Material Movement setup in Origin Blocks. The screen components differ depending on the scheduling module and the setup type that you have currently open.
|
|
1. Launch button
The Workbench launch button ( ) is a general menu containing a few relevant options. From here you can launch Evolution, various other tools and utilities, and configure Workbench preferences.
2. Evolution ribbon
The Evolution ribbon at the top of the screen lists tools that you can use to create, configure, validate, and save setups.

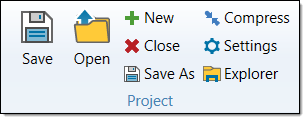
Project
-
 Save: Save an existing project. The project remains open and you can continue to schedule.
 -
 Open: Open an existing project. All Maptek Evolution project files have the .evpx suffix.
 -
 New: Create a new project where you can start importing data and running schedules.
 -
 Close: Close an existing project. If items are open in the viewer, you will be asked to save any changes prior to closing the project.
 -
 Compress: Compress the database of the current project folder. Evolution will temporarily close the project to complete the compression.
 -
 Settings: The settings for currency and decimal places, along with each Evolution setup. See Settings for more information.
 -
 Explorer: Open the current project folder in a new file explorer window.
Tip: Importing and deleting large models in your project can result in using up more disk space than it is actually needed. Use the ![]() Compress tool to optimise your project and to reduce the amount of memory needed to run it.
Compress tool to optimise your project and to reduce the amount of memory needed to run it.
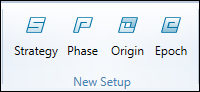
New setup
There are four main modules in Evolution: Strategy, Phase, Origin, and Epoch. Click the icon corresponding to the scheduling module in which you want to create a new setup.
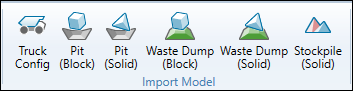
Import Model
The Import group contains tools allowing you to import items into the active project. These are the components that go into a setup for creating a final schedule.
See also: Models
New Model
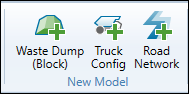
- Waste Dump (Block): Generate a new waste utility using the user's footprint and topology DXF within specified lift, lift-height, slope angle, and area parameters.
- Truck Config: Add new trucks to your project. See Creating Trucks for more information.
- Road Network: Create road networks (using the Vulcan design database (
.dgd.isis) or CSV files) that you can use in optimisation and cycle type calculations. See Importing and Modifying Road Networks for more information.
See also: Road Network
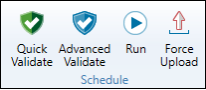
Schedule
The Schedule group contains the functions for submitting jobs to the Maptek Evolution processing server.
-
 Quick Validate: Perform the minimum checks required for a setup to be submitted for server-side processing.
-
 Advanced Validate: Use the Advanced Validate function to diagnose setup errors that occur during server-side processing and have not been detected during quick validation.
 -
 Run: Schedule a setup from the currently open project.
-
 Force Re-upload: Reupload all models to the server the next time you send a setup to the server.
Note: Advanced validation takes longer to run, as it performs more thorough checks than ![]() Quick Validate.
Quick Validate.
Note: Only the setups that have passed quick validation can be scheduled.
3. Project explorer
The project explorer allows you to browse, organise, and select your project data.
A toolbar located at the top of the project explorer contains tools to add, delete, and manipulate project items and folders in the project explorer.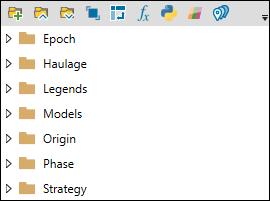
 Add Folder
Click the ![]() button to add a new folder to your project. The folder’s default name will be New Folder.
button to add a new folder to your project. The folder’s default name will be New Folder.
To change the folder name, right-click on it, select ![]() Rename and enter the desired name.
Rename and enter the desired name.
 Collapse All Items
To collapse all of the folders in the project explorer, click the ![]() button in the project explorer toolbar.
button in the project explorer toolbar.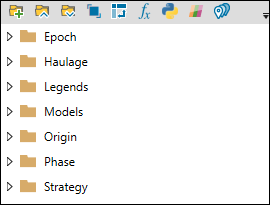
 Expand All Items
To expand all of the folders in the project explorer, click the ![]() button in the project explorer toolbar.
button in the project explorer toolbar.
 Sync Active Document
Click ![]() (Sync Active Document) to locate in the project explorer a model, setup, or a haulage network that you currently have open in your workspace. Evolution will navigate to the corresponding location in the project explorer even if the given item is nested under the currently collapsed folder.
(Sync Active Document) to locate in the project explorer a model, setup, or a haulage network that you currently have open in your workspace. Evolution will navigate to the corresponding location in the project explorer even if the given item is nested under the currently collapsed folder.
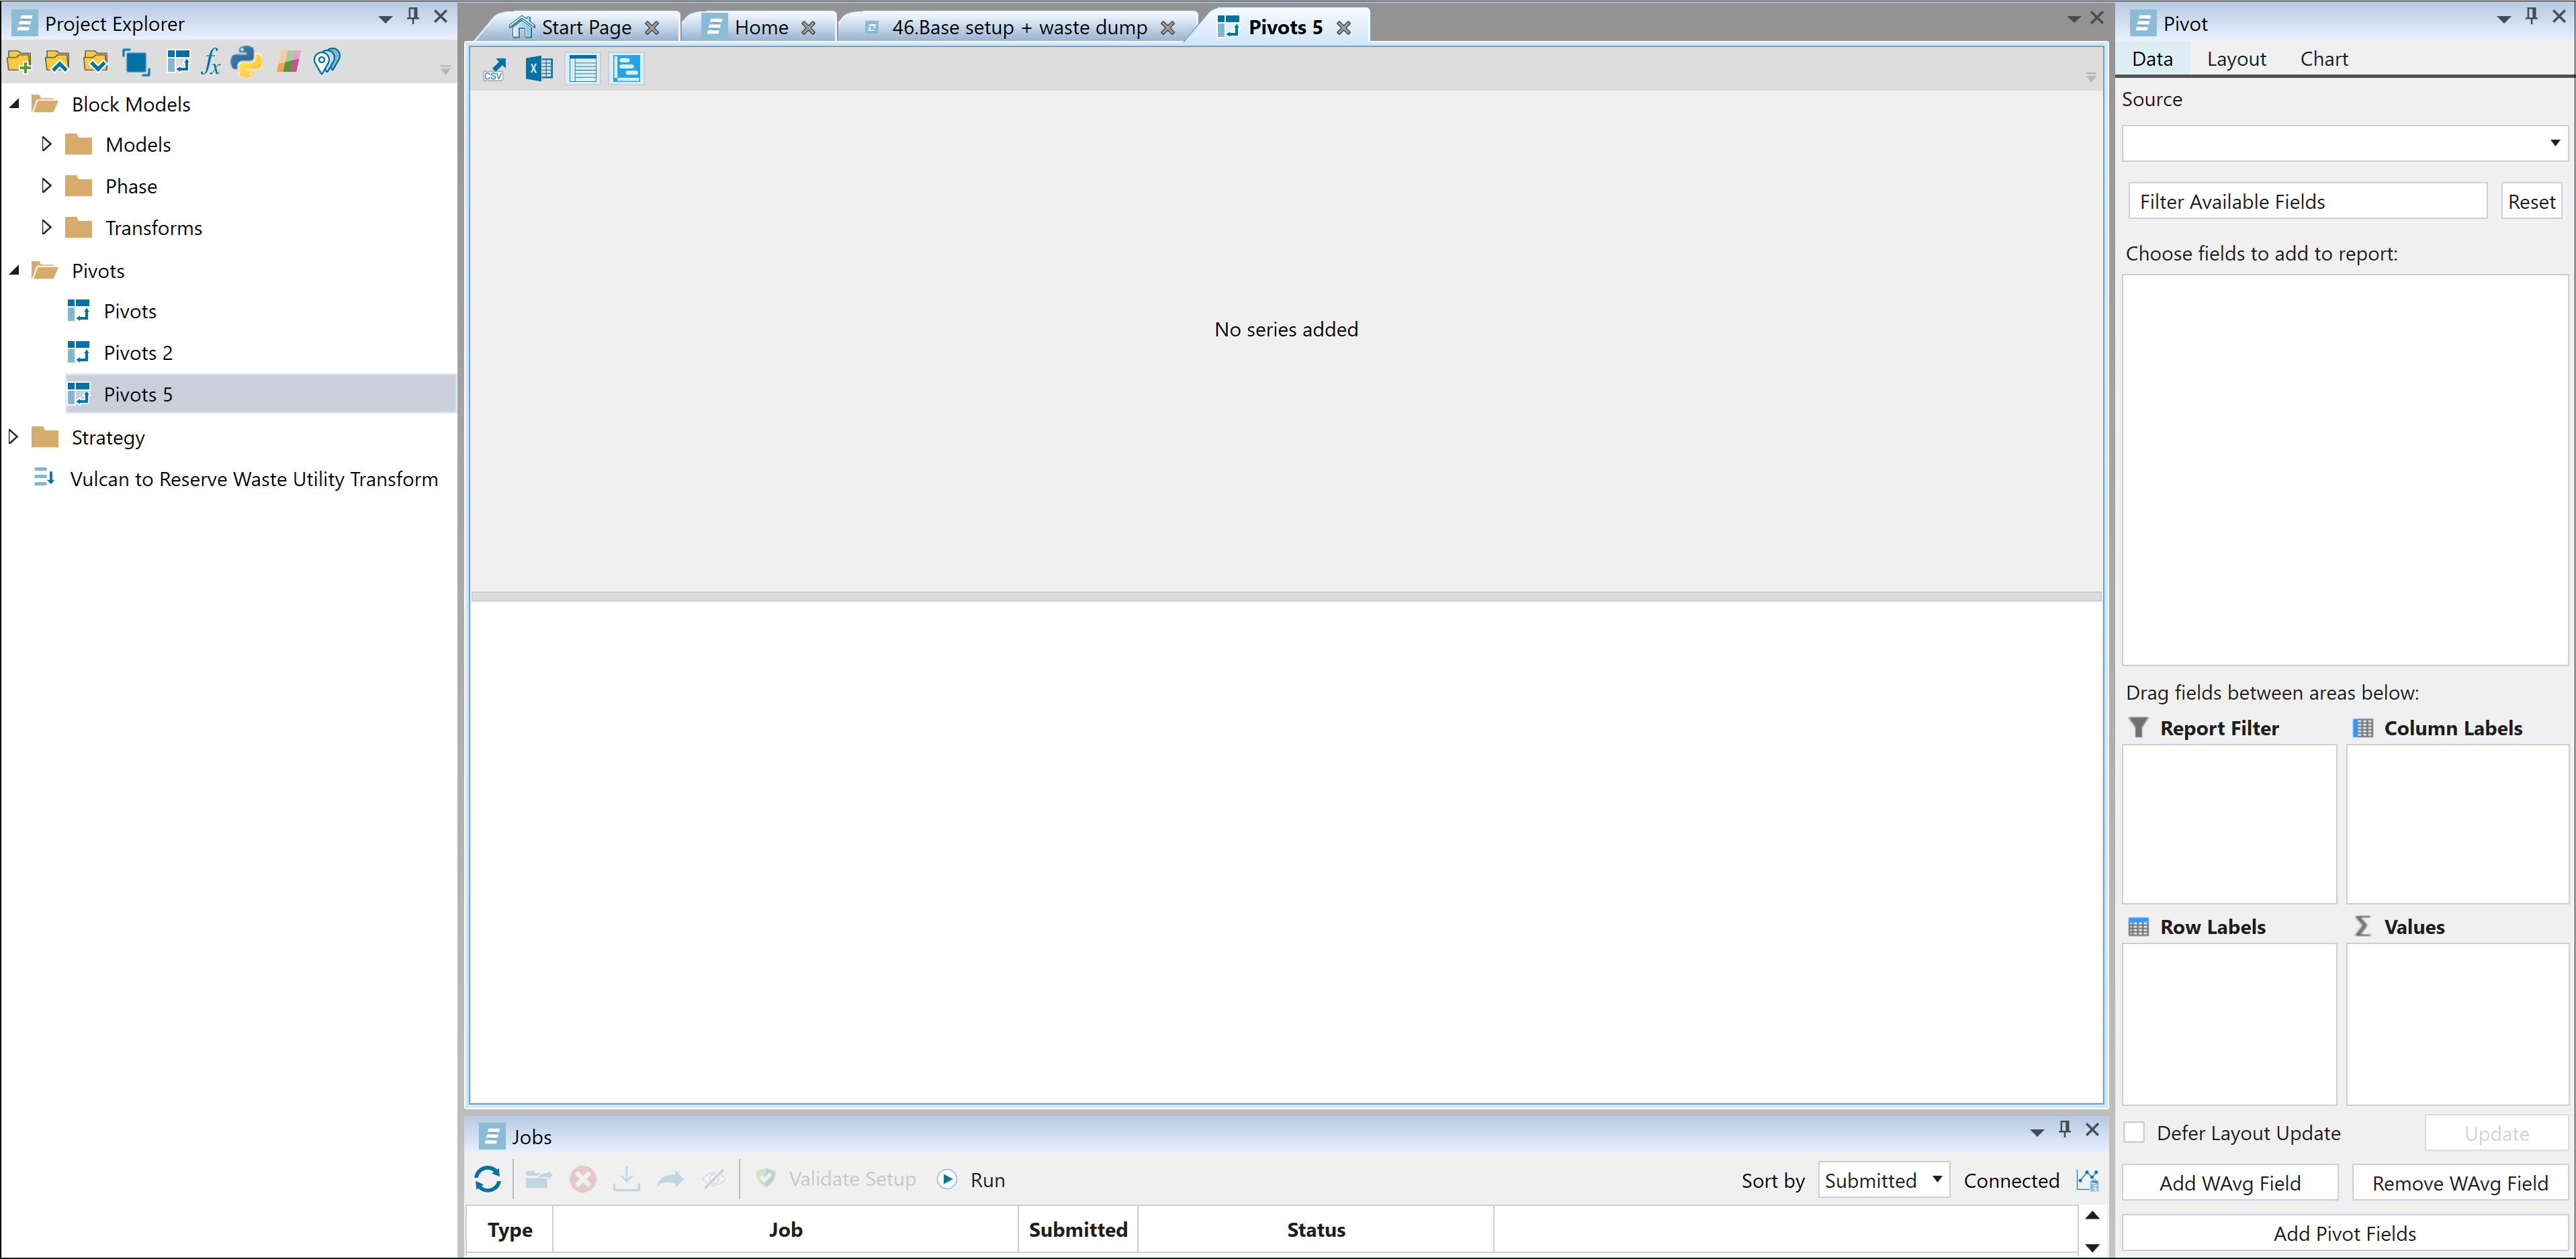
 Add Pivot Report
To add a pivot report to the project explorer, click ![]() (Add Pivot Report) in the project explorer toolbar. Evolution will add a new pivot report to the Pivots folder and open the report in the workspace.
(Add Pivot Report) in the project explorer toolbar. Evolution will add a new pivot report to the Pivots folder and open the report in the workspace.
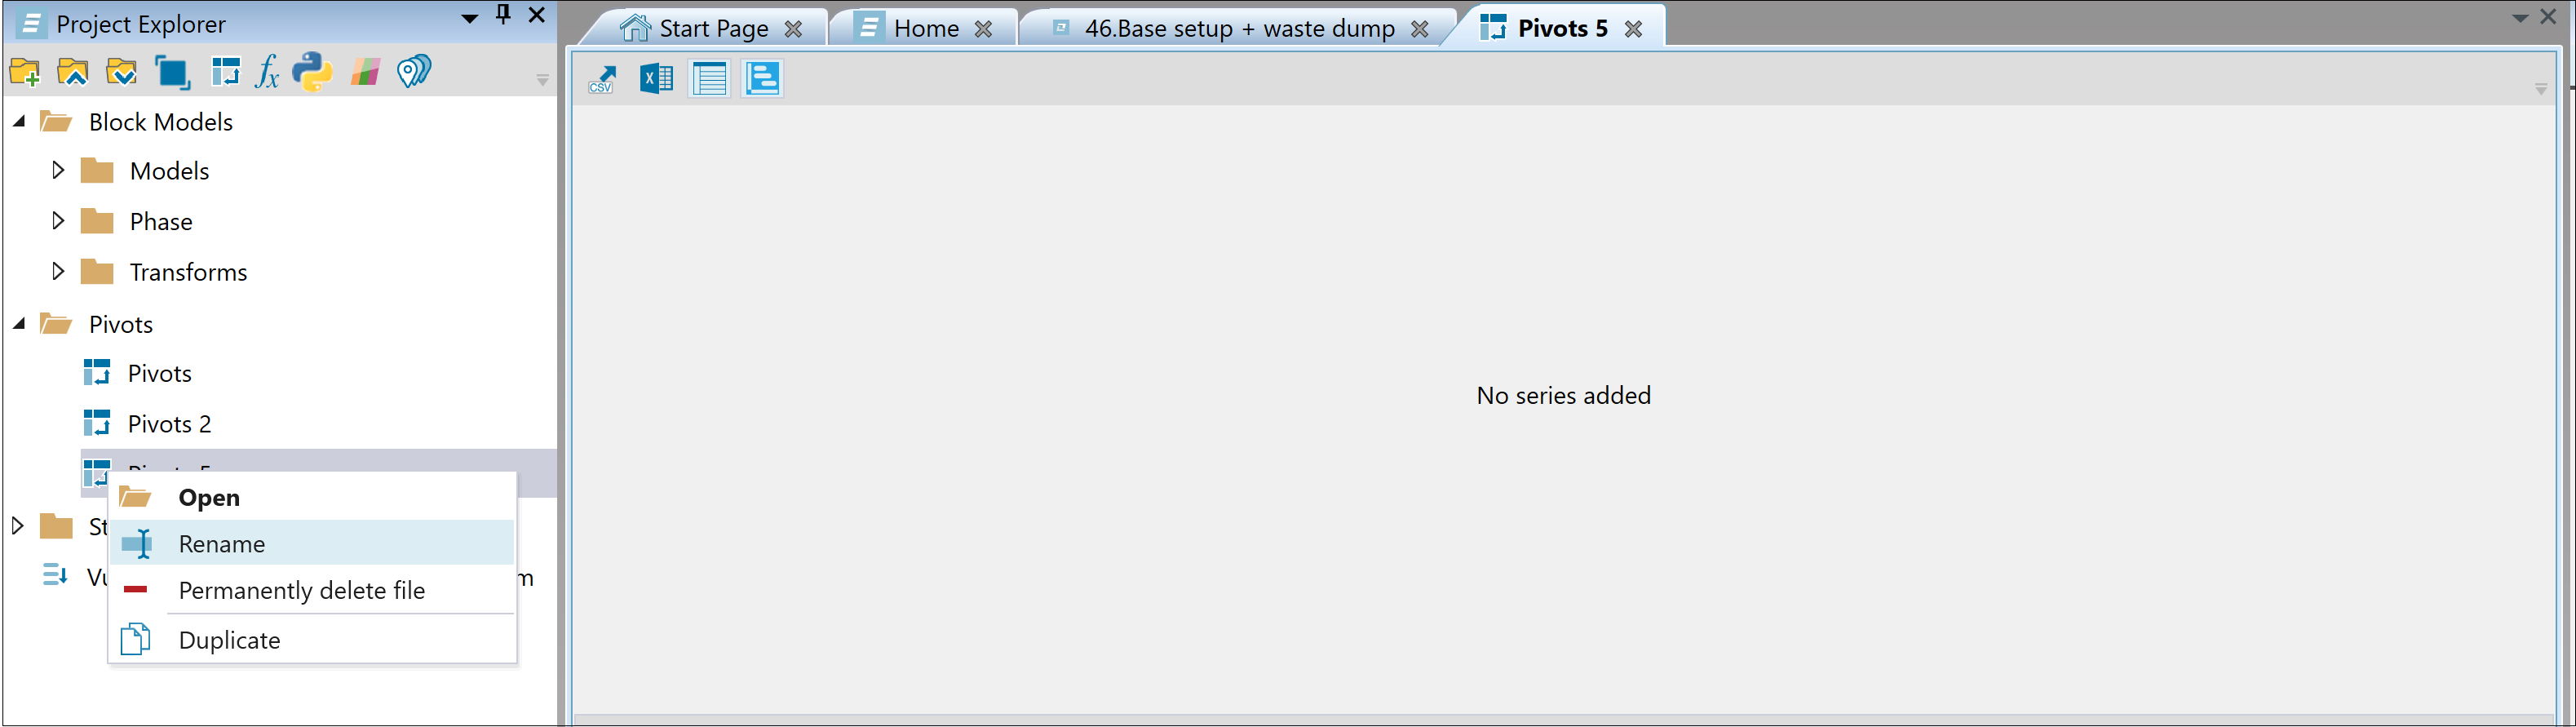
You can change the report name by right-clicking on the pivot in the project explorer and selecting Rename.
For more information on pivot reports, see Pivot Reporting.
 Add Maths
To add a maths script to a specific model, follow these steps:
-
Click the
button in the project explorer toolbar. The Add Maths panel will appear.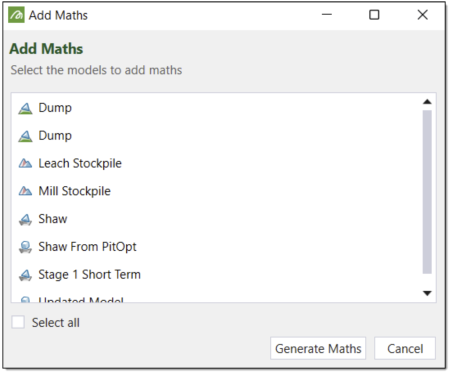
-
Select the model you wish to add the maths script to. Alternatively, you can click the Select all checkbox to add a maths script to every model.
-
Click Generate Maths. Evolution will add a maths script item to each selected model in the project explorer.
-
Edit the scripts using Applying a Maths Script and Maths Scripts for Reserve Models.
 Add Report Script
Click ![]() (Add Report Script) to generate a report script. See Python Report Scripting for more information.
(Add Report Script) to generate a report script. See Python Report Scripting for more information.
 Add Colour Bands
A colour band is a collection of colours you can use to visualise the values of a selected attribute in a model. You can apply it to your model by dragging it into the viewer. Once applied, it is maintained in your project, which gives you the possibility of reusing the same colour band every time.
Note: You can also add colour bands by using the ![]() Add Dynamic Colour function in the View Manager. See View Manager in Origin Blocks, View Manager in Origin Solids, and View Manager in Epoch for more information.
Add Dynamic Colour function in the View Manager. See View Manager in Origin Blocks, View Manager in Origin Solids, and View Manager in Epoch for more information.
You can assign colour bands to particular folders in the project explorer and specify a model attribute to provide the colour bands with values. There are three types of colour bands:
-
Numeric (Ranged): Defines colour bands by numeric ranges, with upper and lower boundaries. For steps on creating numeric (ranged) colour bands, see Creating numeric (ranged) colour bands.
-
Numeric (Categorical): Assigns a colour to each distinct numeric value. For steps on creating numeric (categorical) colour bands, see Creating numeric (categorical) colour bands.
-
Text (Categorical): Assigns a colour to each distinct text value. For steps on creating text (categorical) colour bands, see Creating text (categorical) colour bands.
Creating numeric (ranged) colour bands
To create numeric (ranged) colour bands, follow these steps:
-
Click the
 (Add Colour Bands) button in the project explorer toolbar. The Add Colour Bands panel will appear.
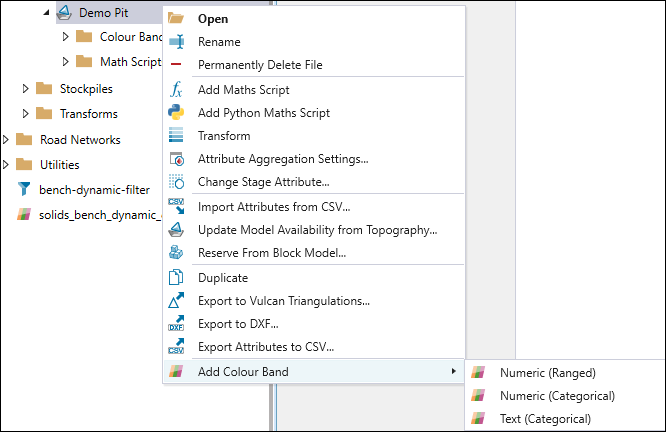
Tip: You can also enter the workspace for creating colour bands by right-clicking on the model to which you want to apply colour bands and selecting the required type from the context menu.
-
Select the folders you want to add colour bands to. You can either select individual folders or select the Select all checkbox.
Tip
Alternatively, you can select the folders using the following keyboard shortcuts:To select a contiguous group of folders, use Shift+click.
To select a group of non-contiguous folders, use Ctrl+click.
To select all of the folders, use Ctrl+A.
-
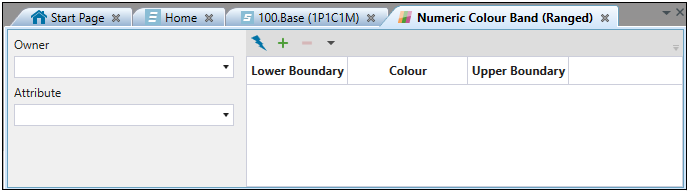
Select Numeric (Ranged). Evolution will add a Numeric Colour Band (Ranged) object to your project and open it in the workspace.
-
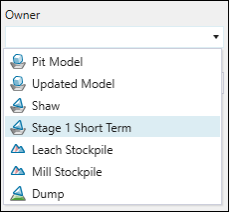
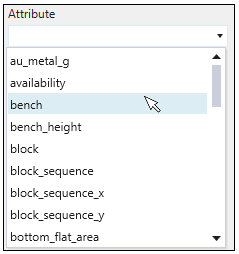
Select an owner model from the Owner drop-down. The numeric attributes from the selected model will appear in the Attribute drop-down.
-
Select a variable from the Attribute drop-down. If you automatically generate the colour bands, Evolution will base the numeric ranges on the attribute you select.
Note: To create a colour band filter that is based on the period or rank, you will have to stamp your model first. For more information on stamping models, see Stamp Period and Rank Back to Model.
-
Generate the colour bands. You can do this automatically or manually with the following options.
-
Generate colour bands automatically using the functions implemented in Evolution.
 Expand for information on generating colour bands automatically
-
Click the
 button. The Generate Colour Bands panel will appear. The Based on values contained in: and Attribute fields honour the Owner and Attribute selections you made in the workspace window.
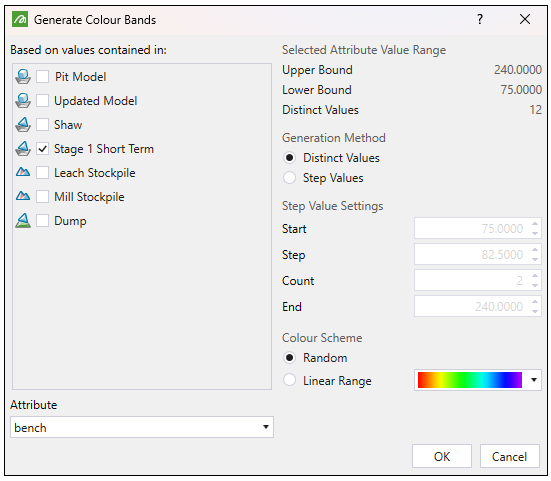
-
Optionally, select a different model checkbox and attribute from the Based on values contained in: list and Attribute drop-down respectively.
-
Select the desired radio button from the Generation Method field. You can select from the following:
-
Distinct Values. This method uses the values in the Distinct Values, Lower Bound and Upper Bound fields to create the colour bands.
Example
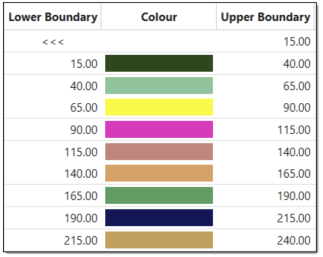
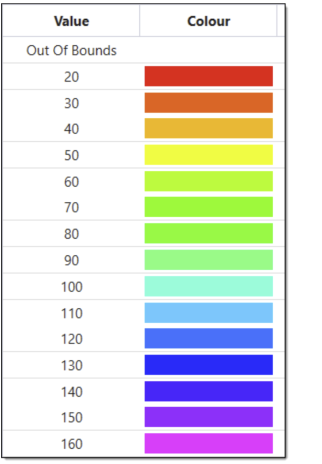
In the image below, we can see there are 16 distinct values which correspond to the number of distinct colour bands. We also have a lower bound of 15 and an upper bound of 240.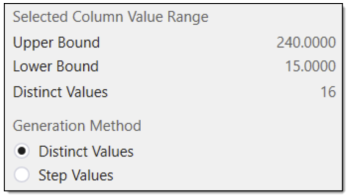
Since this colour band is ranged, the first distinct colour band centres around the lower bound of 15. The colour band boundaries then increment upwards by 15 to create 16 distinct colour bands. The last distinct colour band centres around the upper bound of 240, as expected.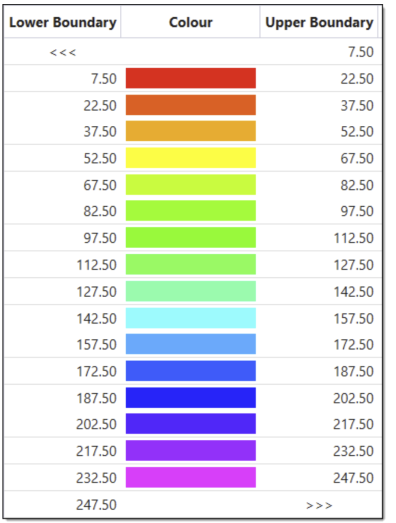
-
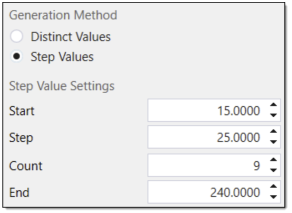
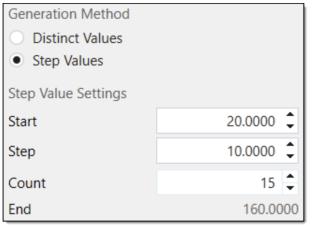
Step Values. This method allows you to configure the colour band values. To do this, enter the desired values into the following Step Value Settings fields:
-
Start. Enter the desired starting band value.
-
Step. Enter the desired band step value. Note that if you change the Count value, Evolution will automatically correct the Step value, for the given Start and End values.
-
Count. Enter the desired number of distinct bands.
-
End. Enter the desired ending band value.
-
-
-
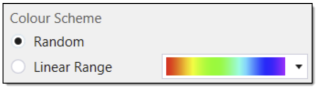
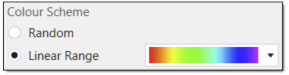
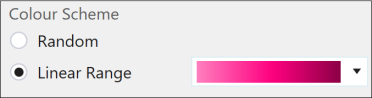
Select the desired radio button from the Colour Scheme field. You can select from the following:
-
Random. This radio button produces random colours for the colour bands.
-
Linear Range. This radio button allows you to select a linear colour scheme from the colouring drop-down.
-
-
Click OK. Evolution will generate the colour bands and fill in the workspace table. Note that the image below was generated via the Step Values method.
-
-
Generate colour bands by manually inputting the range and the colour corresponding to each band.
Expand for information on generating colour bands manually
-
Click
to add a colour band row to the table. Continue adding rows until the table contains the desired number of colour bands.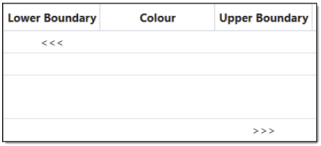
-
Enter the desired values into the Upper Boundary and Lower Boundary column fields.
Tip: As you enter an Upper Boundary value, Evolution will copy this value into the Lower Boundary field in the row below. You can then continue adding values until you have the desired colour band boundaries.
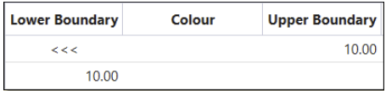
Note: The less than symbol <<< in the Lower Boundary cell of the first row signifies that this band accounts for any values below the corresponding Upper Boundary value. The greater than symbol >>> in the Upper Boundary cell of the last row signifies that this band accounts for any values above the corresponding Lower Boundary value.
-
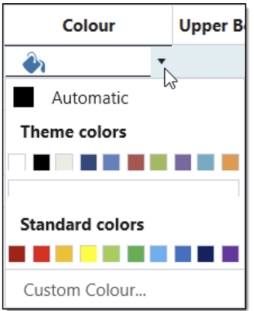
Select a colour for each band using the Colour column drop-down options.
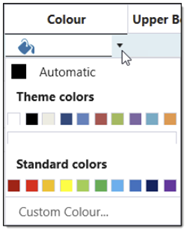
-
Optionally, select
 to generate a linear colour spectrum for the colour bands.
-
-
To apply generated colour bands:
-
Open your model in the viewer.
-
Drag and drop your created colour band from the project explorer to the model displayed in the viewer.
Note: The default name of your colour band will depend on the type of colour band you have selected (Numeric (Ranged), Numeric (Categorical), Text (Categorical)). If a colour band of the same type is created again, a consecutive number will be added to the default name.
Example:
You can change the name of a colour band by right-clicking on it. -
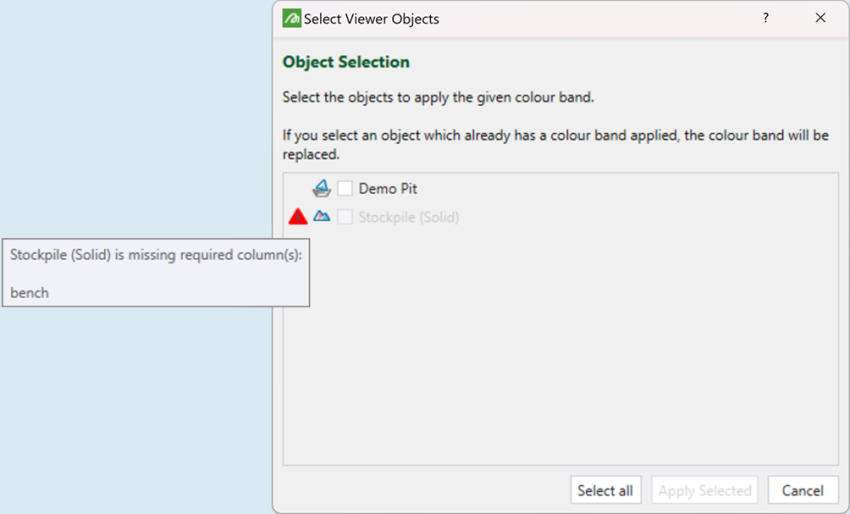
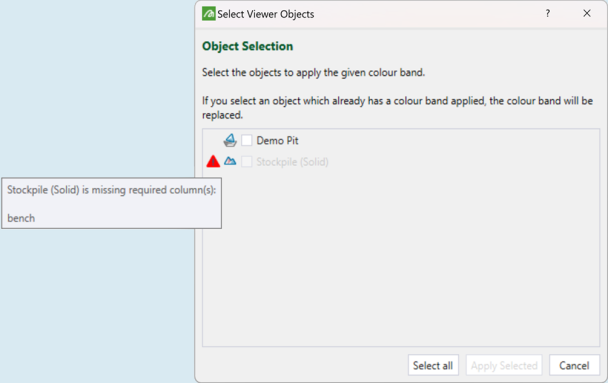
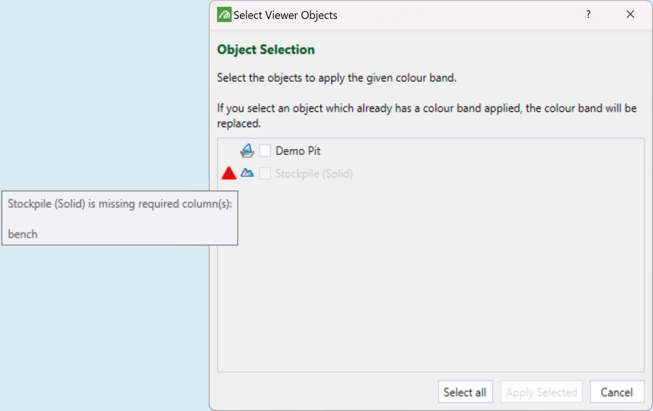
On the Select Viewer Objects pop-up window, select the objects to apply the given colour band and click Apply Selected.
Note: A warning sign will be displayed next to the objects that cannot be selected. Hover over it to get additional information.
-
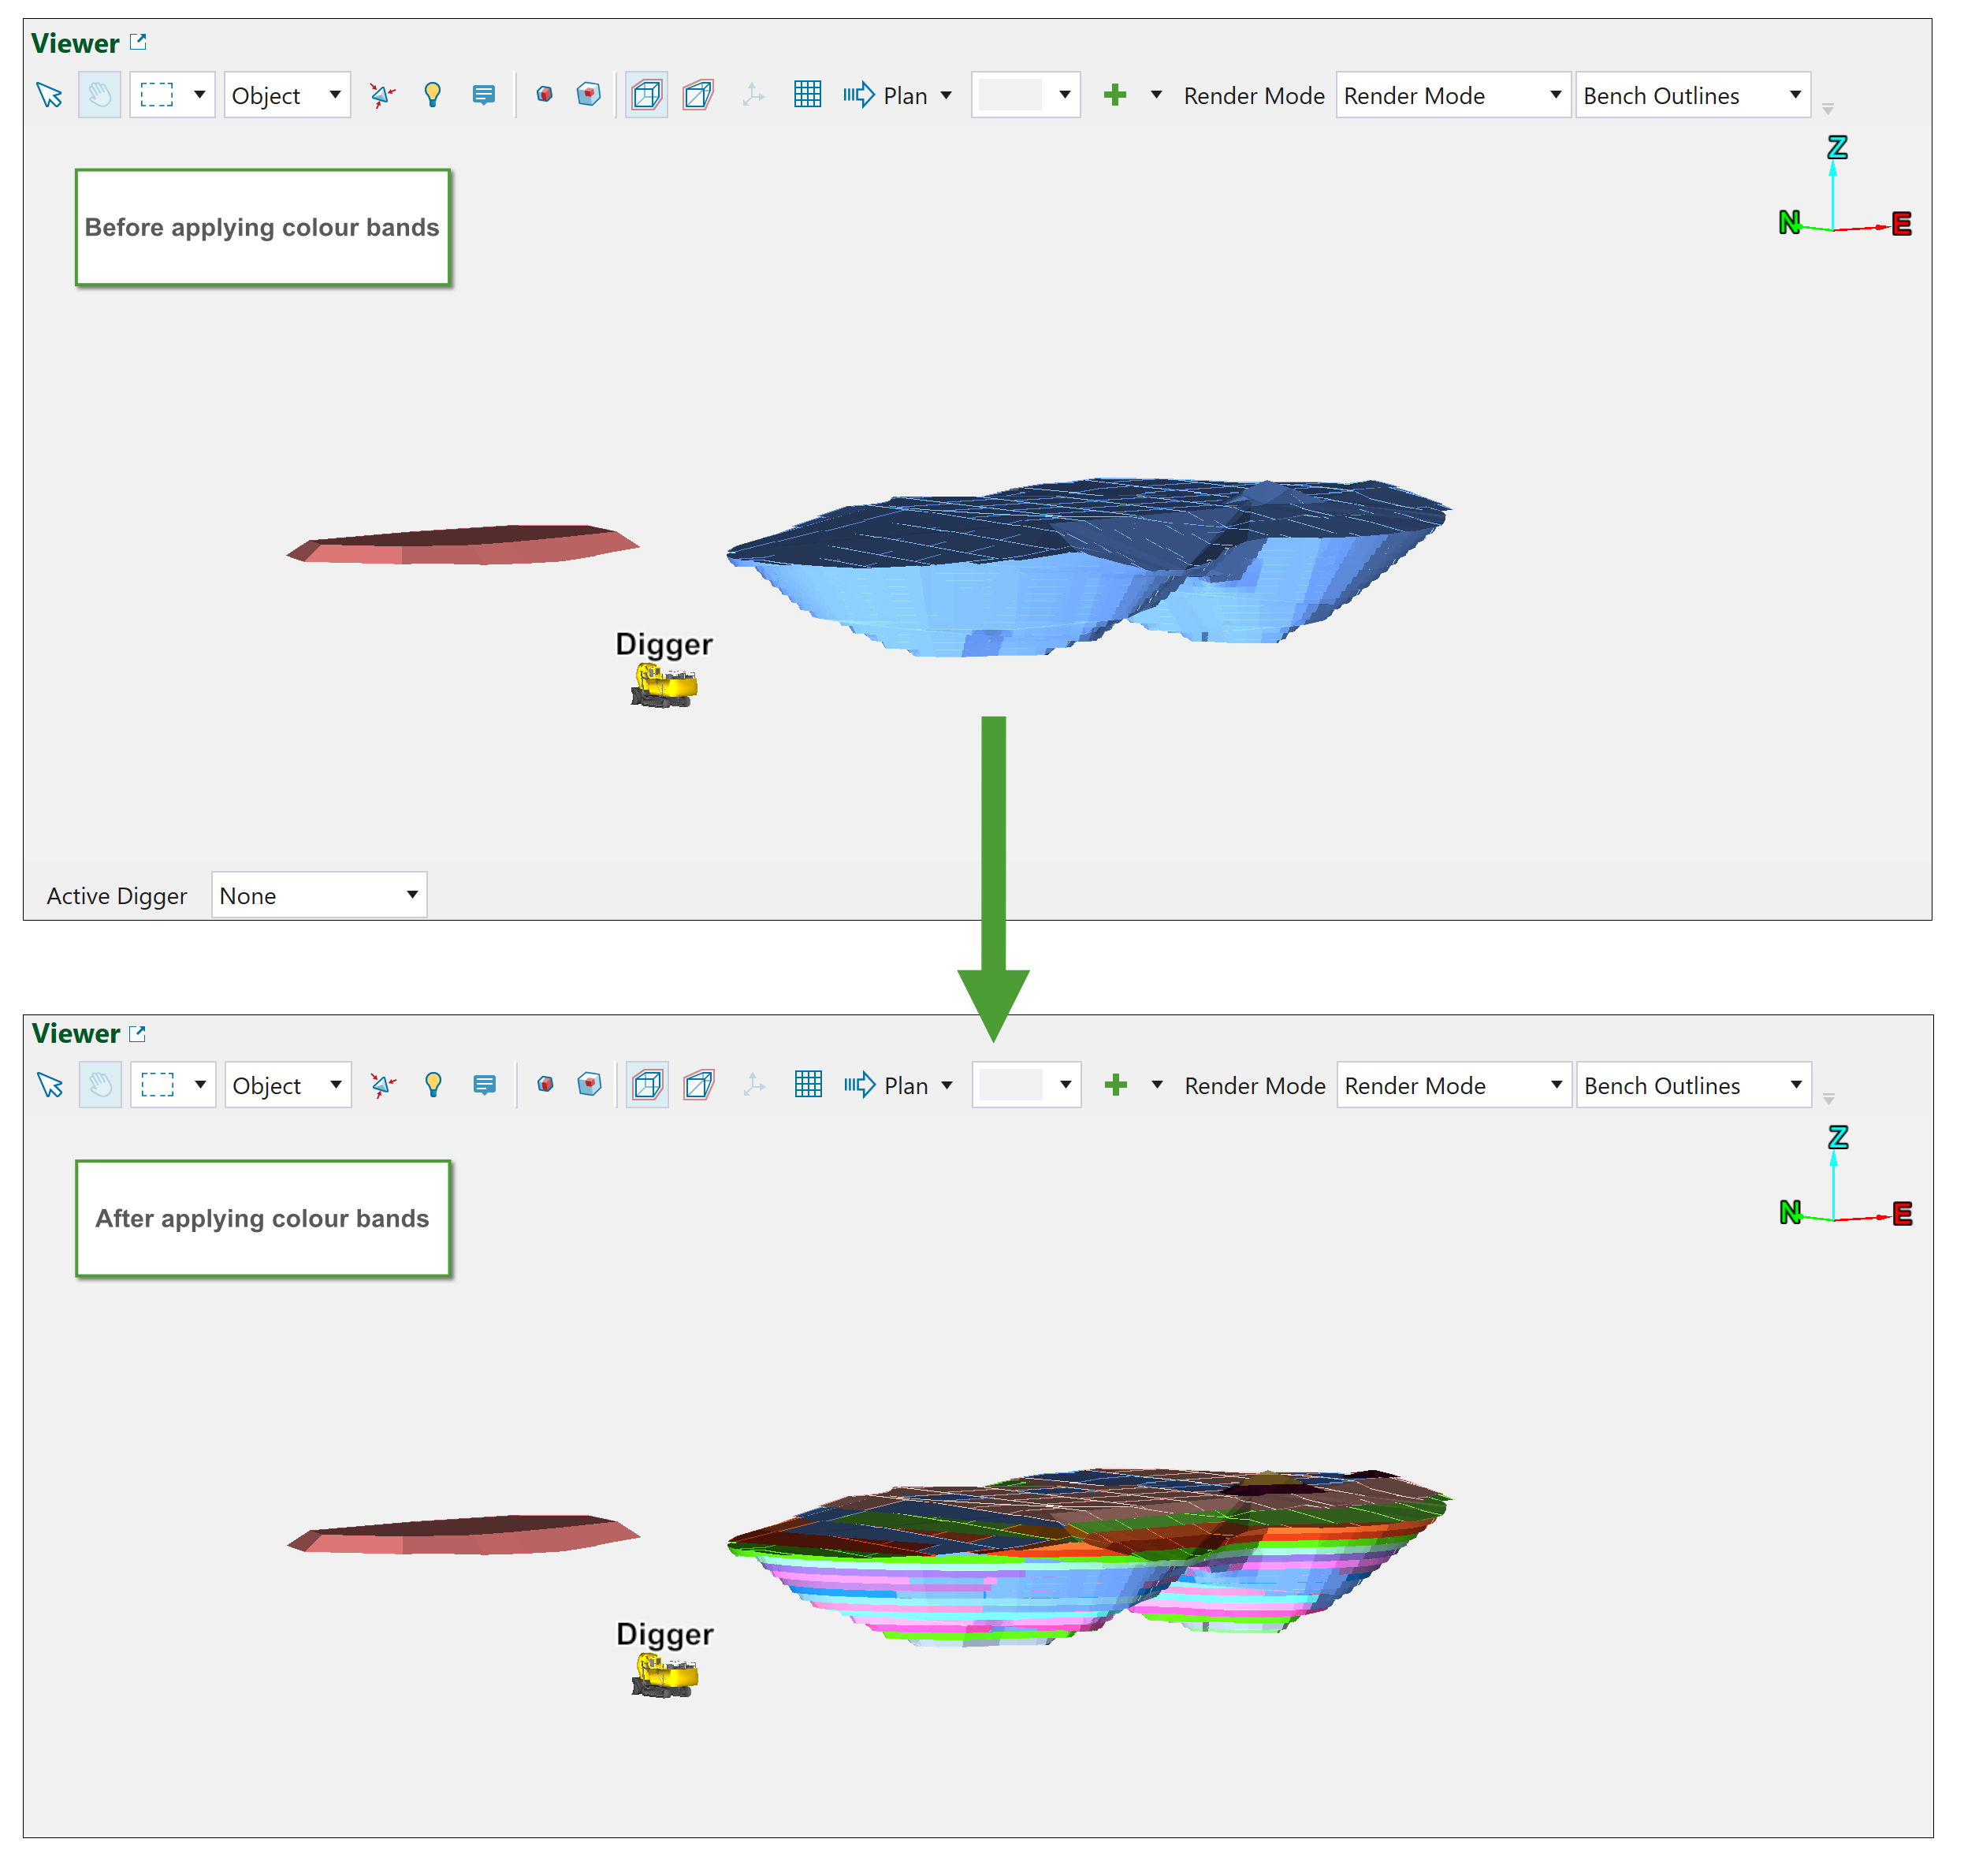
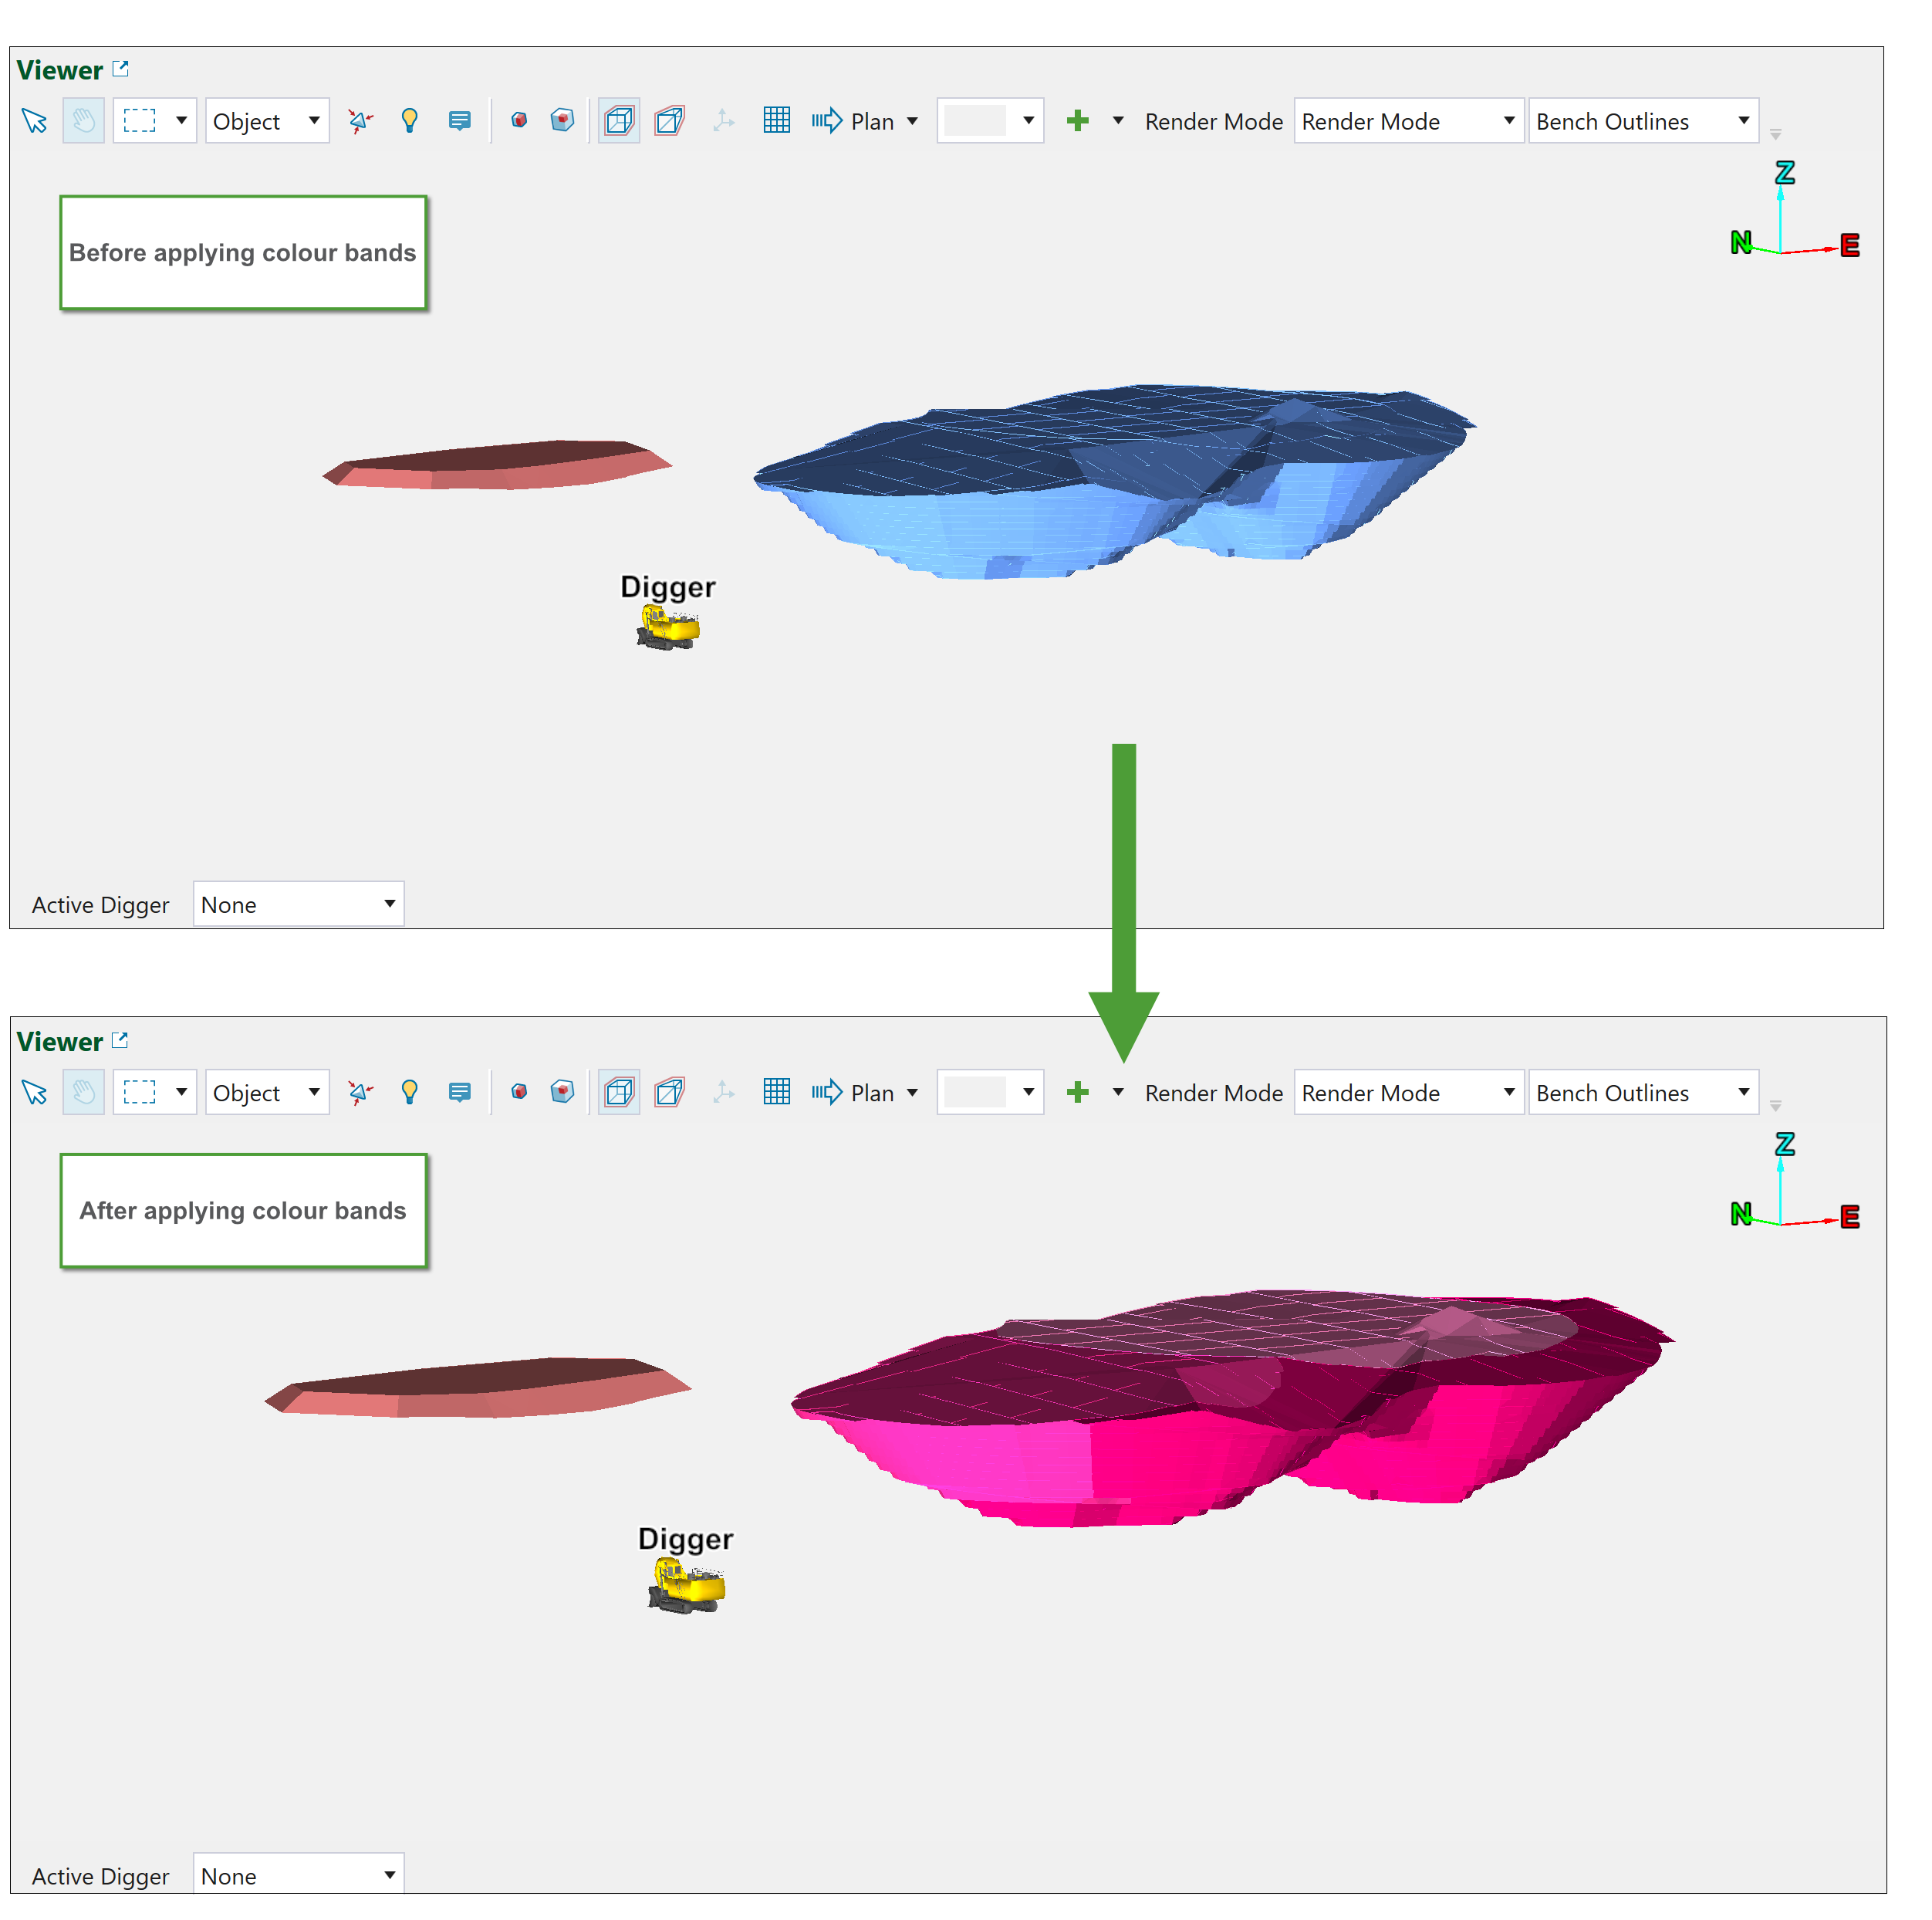
The colour scheme will be applied to your model accordingly.
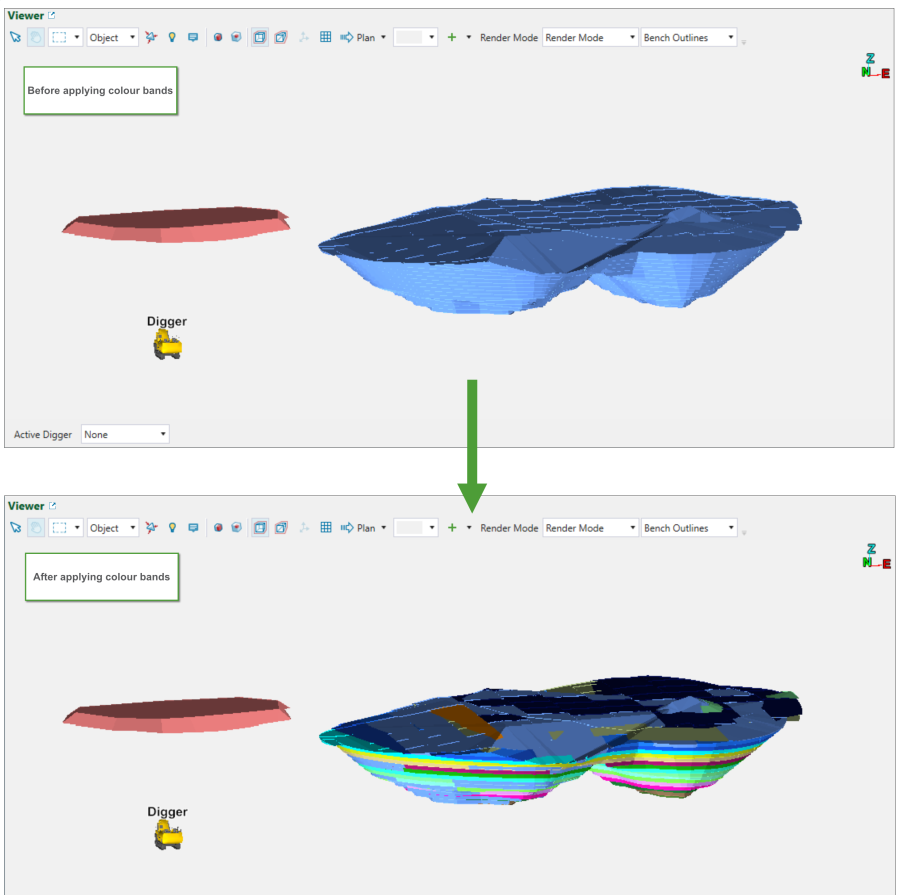
-
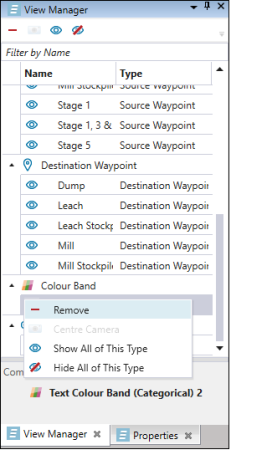
The View Manager that is located on the right-hand side of the viewer will display all the items that are currently applied in the scene. To delete the colour band from your model, right-click the name of the colour band and select
 Remove.
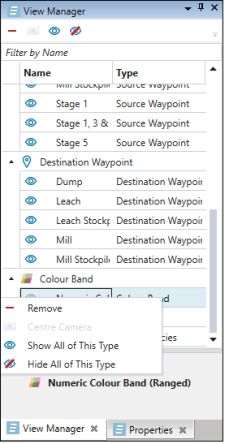
Creating numeric (categorical) colour bands
To create numeric (categorical) colour bands, follow these steps:
-
Select
Add Colour Bands from the project explorer toolbar. The Add Colour Bands panel will appear.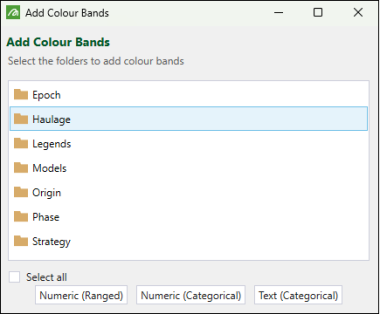
Tip: You can also enter the workspace for creating colour bands by right-clicking on the model to which you want to apply colour bands and selecting the required type from the context menu.
-
Select the folders you want to add colour bands to. You can either select individual folders or select the Select all checkbox.
Tip
Alternatively, you can select the folders using the following keyboard shortcuts:To select a contiguous group of folders, use Shift+click.
To select a group of non-contiguous folders, use Ctrl+click.
To select all of the folders, use Ctrl+A.
-
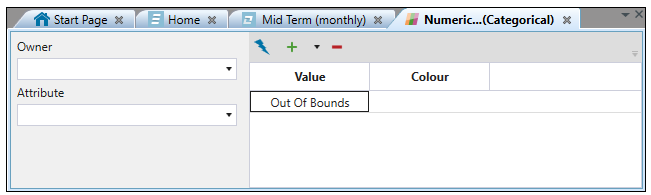
Select Numeric (Categorical). Evolution will add a numeric colour band (categorical) object to your project and open it in the workspace.
-
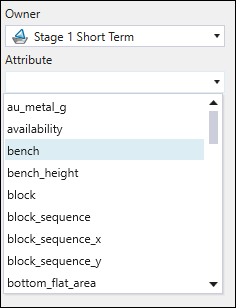
Select an owner model from the Owner drop-down. The numeric attributes from the selected model will appear in the Attribute drop-down.
-
Select a variable from the Attribute drop-down. If you automatically generate the colour bands, Evolution will base the numeric values on the attribute you select.
-
Generate the colour bands. You can do this automatically or manually with the following options.
-
Generate colour bands automatically using the functions implemented in Evolution.
Expand for information on generating colour bands automatically
-
Select
 . The Generate Colour Bands panel will appear. The Based on values contained in: and Attribute fields honour the Owner and Attribute selections you made in the workspace window.
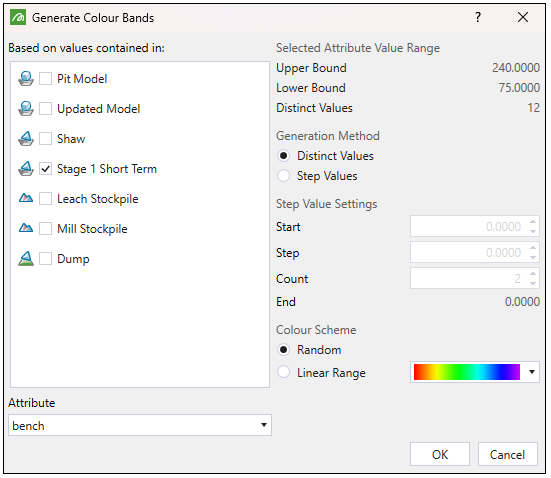
-
Optionally, select a different model checkbox and attribute from the Based on values contained in: list and Attribute drop-down respectively.
-
Select the desired radio box from the Generation Method field. You can select from the following:
-
Distinct Values. This method uses the values in the Distinct Values, Lower Bound and Upper Bound fields to create the colour bands.
Example
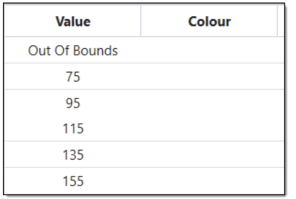
In the image below, we can see there are 12 distinct values which correspond to the number of distinct colour bands. We also have a lower bound of 75 and an upper bound of 240.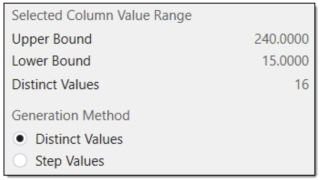
Since this colour band is categorical, the first distinct colour band corresponds to 75. The colour band boundaries then increment upwards by 15 to create 12 distinct colour bands. The last distinct colour band corresponds to 240, as expected.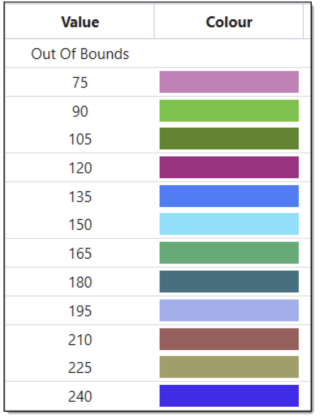
-
Step Values. This method allows you to configure the colour band values. To do this, enter the desired values into the following Step Value Settings fields:
-
Start. Enter the desired starting band value.
-
Step. Enter the desired band step value.
-
Count. Enter the desired number of distinct bands.
-
End. Evolution calculates the ending colour band value based on the Start, Step and Count values.
-
-
-
Select the desired radio button from the Colour Scheme field. You can select from the following:
-
Random. This radio button produces random colours for the colour bands.
-
Linear Range. This radio button allows you to select a linear colour scheme from the colouring drop-down.
-
-
Click OK. Evolution will generate the colour bands and fill in the window table. Note that the image below was generated via the Step Values method.
-
-
Generate colour bands by manually inputting the range and the colour corresponding to each band.
Expand for information on generating colour bands manually
-
Click
 to add a colour band row to the table. Continue adding rows until the table contains the desired number of colour bands.
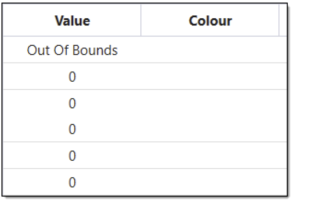
-
Enter the desired values into the Value column fields.
-
Select a colour for each band using the Colour column drop-down options.
-
-
To apply generated colour bands:
-
Open your model in the viewer.
-
Drag and drop your created colour band from the project explorer to the model displayed in the viewer.
Note: The default name of your colour band will depend on the type of colour band you have selected (Numeric (Ranged), Numeric (Categorical), Text (Categorical)). If a colour band of the same type is created again, a consecutive number will be added to the default name.
Example: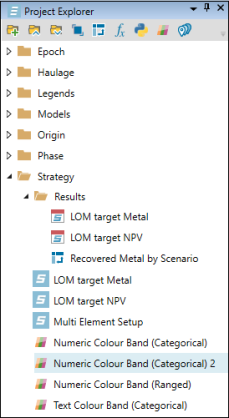
You can change the name of a colour band by right-clicking on it. -
On the Select Viewer Objects pop-up window, select the objects to apply the given colour band and click Apply Selected.
Note: A warning sign will be displayed next to the objects that cannot be selected. Hover over it to get additional information.
-
The colour scheme will be applied to your model accordingly.
-
The View Manager that is located on the right-hand side of the viewer will display all the items that are currently applied in the scene. To delete the colour band from your model, right-click the name of the colour band and select
Remove. 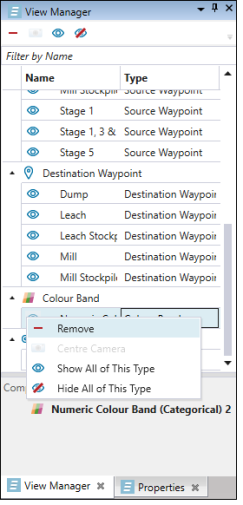
Creating text (categorical) colour bands
To create text (categorical) colour bands, follow these steps:
-
Select
Add Colour Bands from the project explorer toolbar. The Add Colour Bands panel will appear.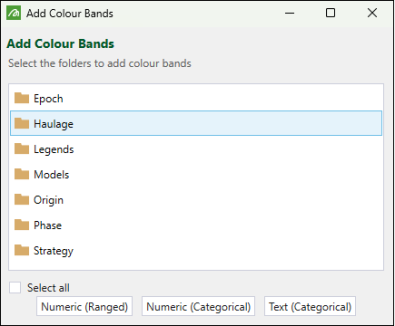
Tip: You can also enter the workspace for creating colour bands by right-clicking on the model to which you want to apply colour bands and selecting the required type from the context menu.
-
Select the folders you want to add colour bands to. You can either select individual folders or select the Select all checkbox.
Tip
Alternatively, you can select the folders using the following keyboard shortcuts:To select a contiguous group of folders, use Shift+click.
To select a group of non-contiguous folders, use Ctrl+click.
To select all of the folders, use Ctrl+A.
-
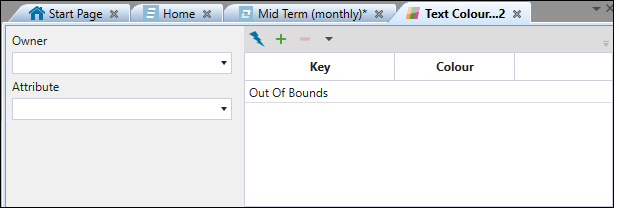
Select Text (Categorical). Evolution will add a Text Colour Band (Categorical) object to your project and open it in the workspace.
-
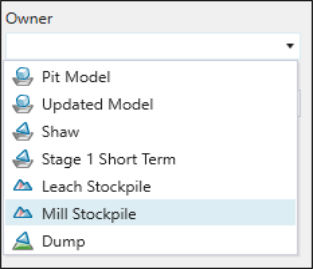
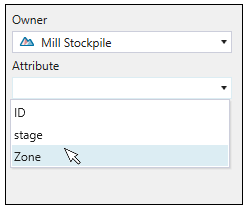
Select an owner model from the Owner drop-down. The text attributes from the selected model will appear in the Attribute drop-down.
-
Select a variable from the Attribute drop-down. If you automatically generate the colour bands, Evolution will base the text keys on the attribute you select.
-
Generate the colour bands. You can do this automatically or manually with the following options.
-
Generate colour bands automatically using the functions implemented in Evolution.
Expand for information on generating colour bands automatically
-
Select
. The Generate Colour Bands panel will appear. The Based on values contained in: and Attribute fields honour the Owner and Attribute selections you made in the workspace window. 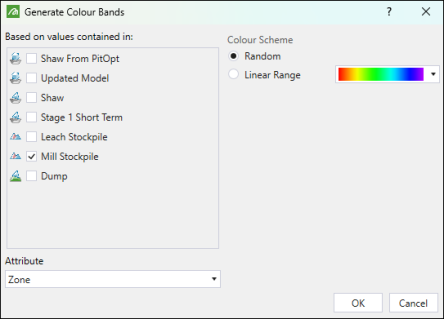
-
Optionally, select a different model checkbox and attribute from the Based on values contained in: field and Attribute drop-down respectively.
-
Select the desired radio button from the Colour Scheme field. You can select from the following:
-
Random. This radio button produces random colours for the colour bands.
-
Linear Range. This radio button allows you to select a linear colour scheme from the colouring drop-down.
-
-
Click OK. Evolution will generate the colour bands and fill in the window table.
-
-
Generate colour bands by manually inputting the range and the colour corresponding to each band.
Expand for information on generating colour bands manually
-
Click
to add a colour band row to the table. Continue adding rows until the table contains the desired number of colour bands.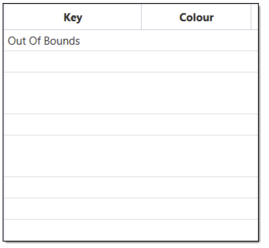
-
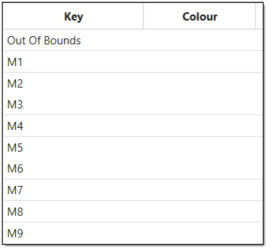
Enter the desired text phrases into the Key column fields.
-
Select a colour for each band using the Colour column drop-down options.
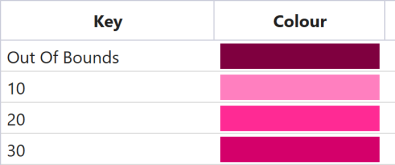
 Example
The following image displays an example colour scheme: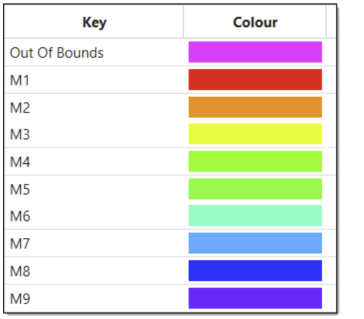
-
Optionally, you can click
 to reorder the colour bands. This will move the Out of Bounds row to the bottom of the colour bands table.
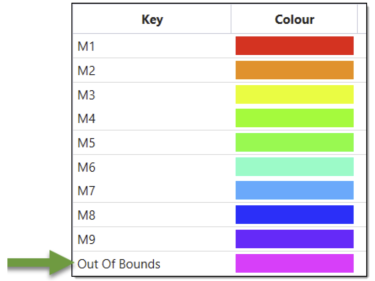
-
-
To apply generated colour bands:
-
Open your model in the viewer.
-
Drag and drop your created colour band from the project explorer to the model displayed in the viewer.
Note: The default name of your colour band will depend on the type of colour band you have selected (Numeric (Ranged), Numeric (Categorical), Text (Categorical)). If a colour band of the same type is created again, a consecutive number will be added to the default name.
Example: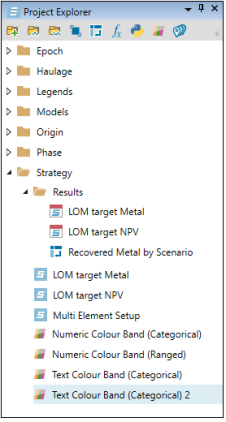
You can change the name of a colour band by right-clicking on it. -
On the Select Viewer Objects pop-up window, select the objects to apply the given colour band and click Apply Selected.
Note: A warning sign will be displayed next to the objects that cannot be selected. Hover over it to get additional information.
-
The colour scheme will be accordingly applied to your model.
-
The View Manager that is located on the right-hand side of the viewer will display all the items that are currently applied in the scene. To delete the colour band from your model, right-click the name of the colour band and select
. 
 Import Waypoints
To import a waypoint collection from a JSON file, follow these steps:
-
Select
Import Waypoints from the project explorer toolbar. The file explorer will appear. -
Select the JSON file (
.json) containing the desired waypoints from the file explorer.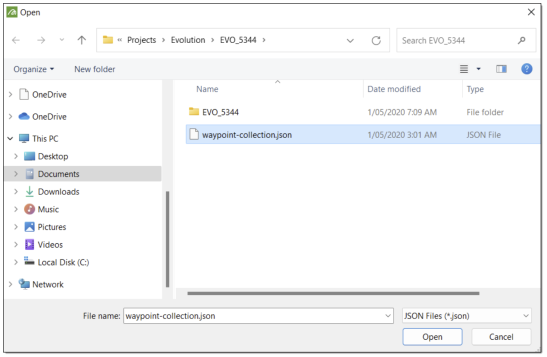
-
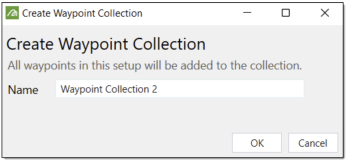
Click Open. The Create Waypoint Collection panel will appear.
-
Optionally, rename the waypoint collection using the Name field.
-
Click OK. Evolution will add the waypoint collection file to the project explorer.
See also: Using the Waypoint Editor, Exporting or Importing a Waypoint Collection as a JSON File, Creating a Waypoint Collection, and Adding and Removing Waypoints
Delete Selected Item
To delete item(s) from the project explorer, select the desired items and click ![]() (Delete Selected Item) from the project explorer toolbar.
(Delete Selected Item) from the project explorer toolbar. 
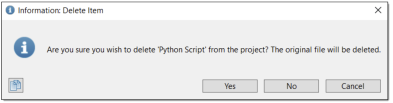
The Information: Delete Item panel will appear. Click Yes to confirm the removal.
You can also delete the required items the following ways:
Select the items, right-click and select
 (Permanently Delete File).
Select the items and press Delete.
Alternatively, you can select the folders using the following keyboard shortcuts:
To select a contiguous group of folders, use Shift.
To select a group of non-contiguous folders, use Ctrl.
To select all of the folders, use Ctrl+A.
Project Explorer Settings
To edit the default folders in the project explorer, select ![]() (Project Explorer Settings) from the project explorer toolbar.
(Project Explorer Settings) from the project explorer toolbar.

Note: Depending on the width of the project explorer, some toolbar items may be hidden in the drop-down. Click ![]() to display the hidden items or increase the width of the project explorer to display all items together within the toolbar.
to display the hidden items or increase the width of the project explorer to display all items together within the toolbar.
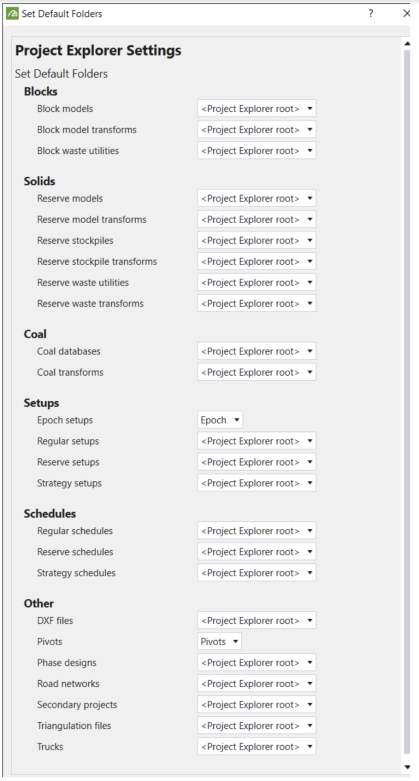
The Set Default Settings panel allows you to configure the default folder for items of each type when they are created.
All block waste utilities will automatically be placed inside the default block waste utilities folder when you create them.
Apply the required settings and click OK to save your changes.
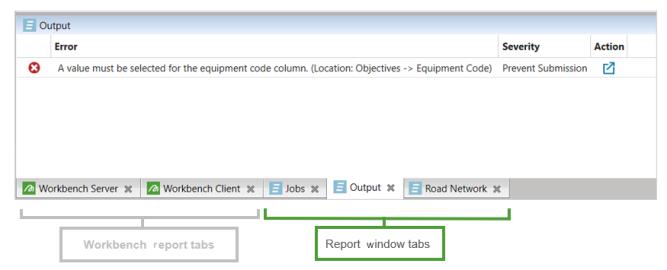
4. Report window
The tabs listed in the report window depend on the setup type that you currently have open.
Note: The Jobs window, which displays the status of a setup submitted to the server for schedule generation, is visible at all times when you have a project open.
See also: Evolution Cloud Service
5. Workspace
You can view and configure models, setups, and schedule data in your workspace.
6. View Manager
The View Manager window, which is used to configure objects in the viewer, is only active when you have opened the viewer.
See also: View Manager and Properties in Origin Blocks, View Manager and Properties in Origin Solids, View Manager and Properties in Epoch
7. Setup configuration tabs
After you load a setup into the workspace, you will be required to configure your setup. The setup configuration tabs provide access to all aspects of a setup that need to be configured. The items that you have to configure differ depending on the type of setup you are creating.
