Load Slice
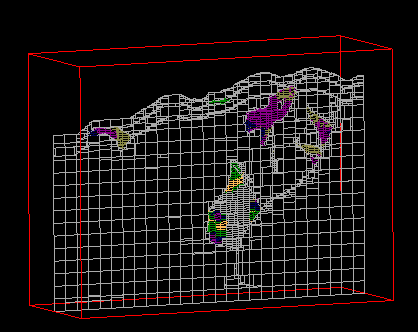
Use this option to load a single block model slice onto the screen. The chosen slice will be displayed as an underlay.
Use the Block > Viewing > List Slice option to obtain a list of slices. The List Slice option also allows you to load multiple slices directly from the list.
Instructions
On the Block menu, point to Block Viewing, then click Load Slice.
Note: If a block model is not currently open, you will be prompted to open one first.
Follow these steps:
-
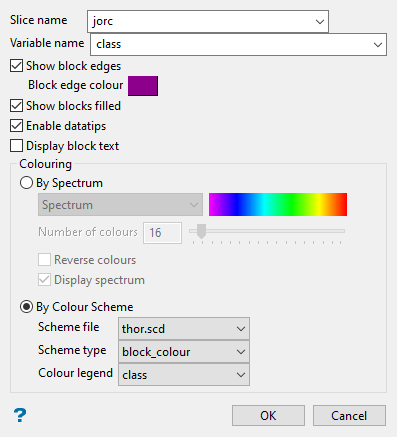
Select the Slice name from the drop-down list. All available slices that are in your current working directory will be listed.
-
Select the Variable name from the drop-down list.
-
Select Show block edges to display the edges of each individual block. You will need to specify a colour for the edges. The colour will be selected from the current colour table.
-
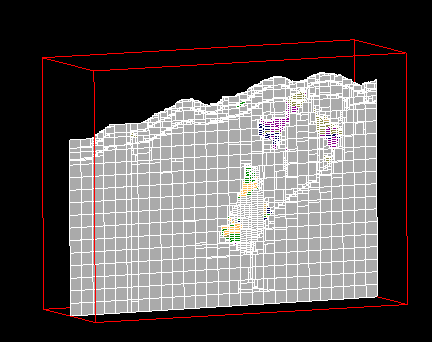
Select Show blocks filled to fill each individual block. Once the Load Slice panel has been completed, you will be required to select a colour legend for the blocks.
-
Select Enable datatips if you want to view the block model variable information in the resulting slice. When you hover the cursor over the slice, the appropriate variable information displays.
Important: The Display Datatips check box (under the Graphics section of Vulcan Preferences) needs to be enabled in order to display datatips.
Note: The datatips are only visible when viewing overlays. They are not visibly when viewing slices as layers.
Note: Datatips can be displayed for both filled and non-filled blocks. However, datatips for non-filled blocks will only be visible when in Section view.
 Setting up datatips
If this check box is selected, the Block Model Datatip Variables panel will be displayed once the main panel has been completed.
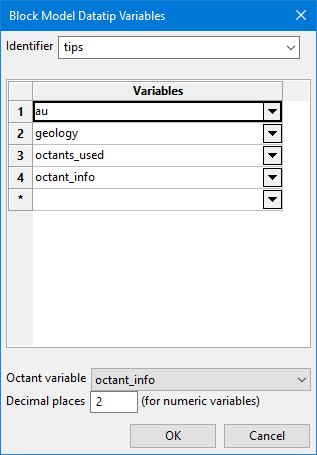
This panel allows you to create and define the template that contains the block model variables that you want to display. The template will be saved to a Block Identifier file
(.bif). This file is named after the name of the project, that is<project_name>.bif.-
Enter a unique name for the panel settings in the space labelled Identfier. The list can then be recalled at a later time by simply selecting the identifier from the drop-down list.
-
Select the variables that you want to display in the datatips. Up to 30 variables can be selected.
-
Select an Octant variable (optional) to hold the information regarding which octants were used in the in the estimation.
ImportantThe variable containing the octant information must be included in the Variables list and be selected as the Octant variable if you want to see it in the datatips. -
Set the number of decimal places you want to view. The number of decimal places enter here will not effect the actual number stored in the model. It is for display purposes only.
Setting up the option to view octant information
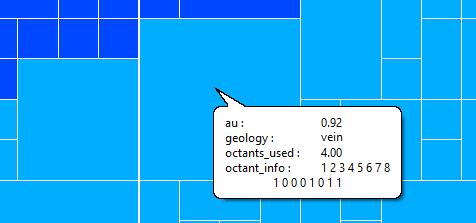
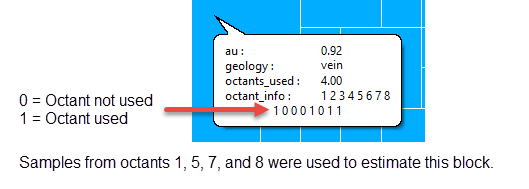
Vulcan stores information regarding whether or not samples from a particular octant were used during estimation. The octants are labelled 1 through 8. If samples from an octant are used during estimation, then the octant is flagged with a 1. If samples from an octant are not used, the octant is flagged with a 0. The variables used to record the number of octants used to estimate a block and record the flag information are stored in variables selected while setting up the estimation parameters.
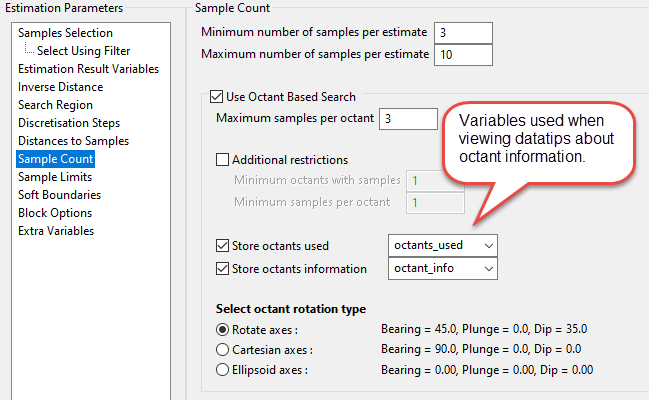
Figure 1 : Screenshot showing panel from Estimation Editor. For information about setting up the estimation variables, see setting up Sample Count .
In the datatips, the octant information is displayed as a small table with the octant number on top and the flag on the bottom.
-
-
Select Display block text if you want to annotate the block model blocks in the resulting slice.
The text annotations are defined through the Block Text panel, which displays after the Block Model Slice panel is completed.
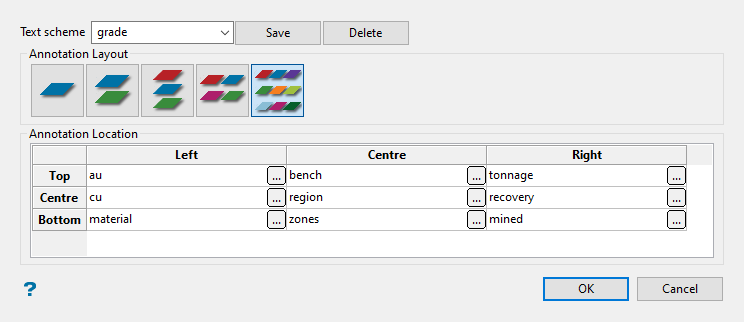
Setting up block text
-
Type a name for the scheme in the textbox and click
 .
. -
Select the layout.
There are five format layouts to choose from as shown by the five icons.

As you click on each of the icons, the Annotation Location display window will reflect the change in layout.
Start by clicking on the small
 button in the top left corner. This will cause the Block Model Variable Annotation panel to open.
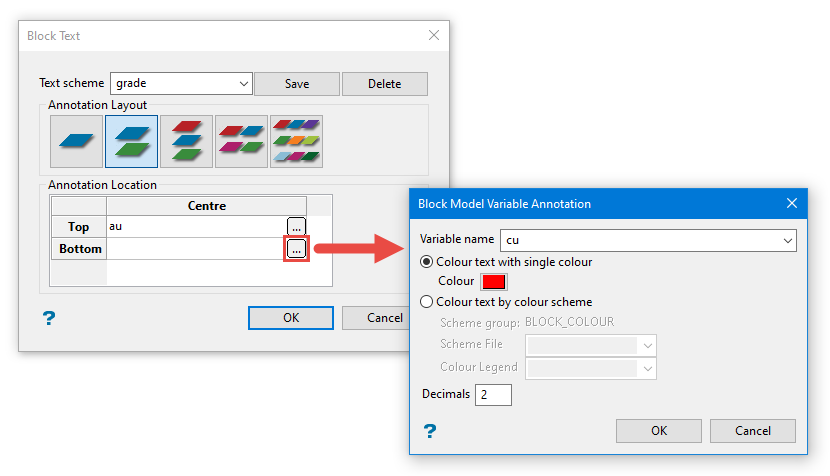
-
-
Set how the block model slice will be coloured using the options in the Colouring section.
Select the By Spectrum option to colour the slice by spectrum. This means that the selected colour spectrum is stretched over the variable values. If you select the Between two RGB values option from the drop-down list, you will need to nominate two colours to stretch over the variable values. For example, if you select red and blue, then the small values would be red, the middle values purple, and the large values blue. The colour of the middle values is an average of the two chosen colours.
Select the By Colour Scheme option to colour the slice by using a Vulcan colour scheme. A default scheme file and type is entered automatically, these can be altered. Select the file, type, and colour legend from the drop-down lists.
-
Click OK.

