Modify Dynamic Model
Use the Modify Dynamic Model option to alter the viewing parameters of a loaded dynamic model. To load a block model for the first time, use Block > Viewing > Load Dynamic Model.
You can also access this option by right-clicking on the dynamic block model and selecting Properties from the displayed context menu.
Instructions
On the Block menu, point to Viewing, then click Modify Dynamic Model.
Follow these steps:
-
Use the Variable drop-down list and the Set Additional button to select the variables you want to display.
NoteClicking the Set Additional button will bring up the Multiple Variable Selection panel.
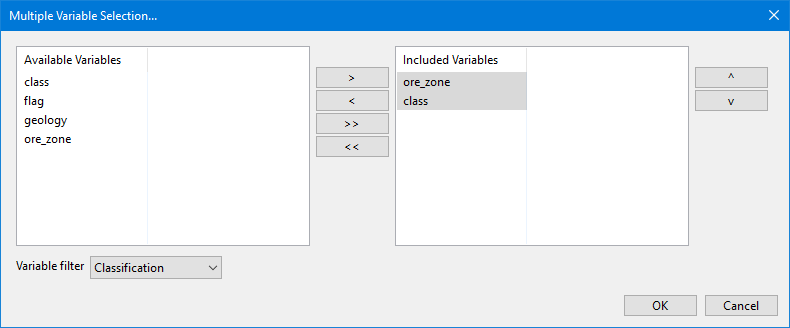
All available variables will be shown in the left column, and the variables you select to display will be listed on the right. You can limit what is displayed in the left column by using the Variable filter.
Use the directional arrows in the middle to move variables from one column to the other.
You can adjust the order of the variables by using the up and down arrows on the right side of the panel. Note that when cycling through the variables while viewing, they will be displayed in the order in which they are listed here.
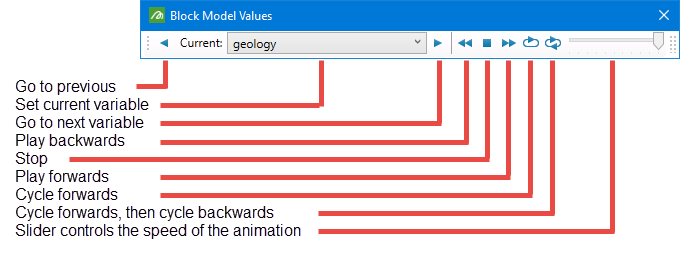
To view the different variables, you must have the Block Model Values toolbar loaded. You can access this toolbar by right-clicking on the bottom or left margins of the viewing area, then selecting the toolbar from the menu.
 ImportantAll blocks are displayed using a block colour legend, and you can only use one legend at a time. Therefore, make sure all the variables you select are of the same type. For example, select all name type variables, or select all numeric type variables. If a block contains a value that is not represented in your colour legend, it will not be displayed.
 -
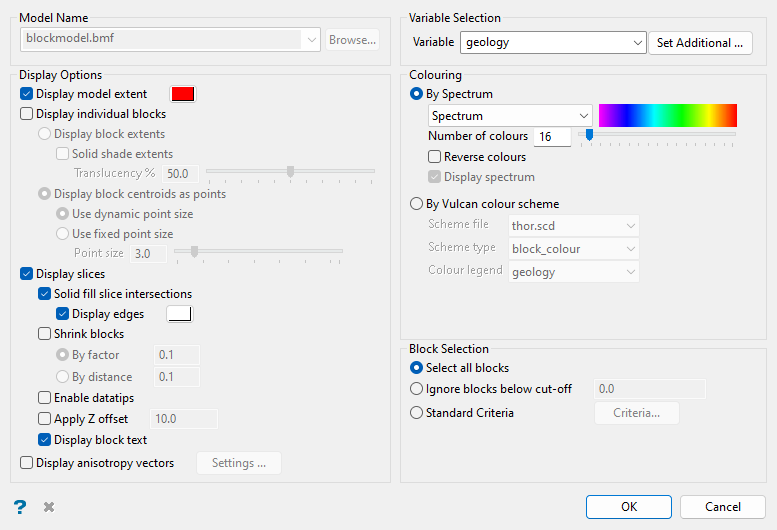
Set the display options.
There are a number of optional settings that allow you to visualise information about your model. Blocks can be viewed as wireframes, solid shading, translucent, with text, displaying centroids, reduced scale, displaying datatips when hovering over with the mouse, displaying octant information used during estimation, and more.
 Display model extent
Select this option if you want to see the boundaries of your block model. By default, the block model extent will be coloured using the colour selected from the current colour table, but you can edit this by clicking the colour icon and selecting a new colour.
Display individual blocks
Select this option to set the parameters for viewing each block. There are two choices:
-
Display block extents - Select this option to display the extents of each block within the block model.
Click Solid shade extents to fill the blocks with a solid colour. Set the translucency by using the slider or by entering a percentage into the space provided. A value of 0 means the blocks are opaque, while a value of 100 means the blocks are invisible.
NoteIf you are displaying triangulations with your block model, it can be helpful to use the translucency setting on either the triangulations or the block model to improve visibility.
-
Select Display block centroids as points to display the centroid of each block within the block model.
-
Select Use dynamic point size to have the size of the centroid, in pixels, determined by Vulcan.
-
Select Use fixed point size to enter the point size manually. Values between 1 and 20 are reasonable, or you can use the slider. You can the slider or enter a a number into the space provided.
Note: For the best results when displaying the centroids, we recommend using the
 Anti-alias feature (on the Effects toolbar). The Anti-alias feature allows you to blend the pixels and lines, resulting in smoother drawn objects.
 -
Display slices
Select this option to section a block model dynamically. If this check box is not checked, then the block sections will not be displayed.
Solid fill slice intersections
Select this check box to shade the intersections between the block model and the slices. The colour of the slices is set through the Colour Scheme section of the panel.
Shrink blocks
Use this option to ensure that the edges do not overlap.
If enabled, you will need to specify a scale factor. If you are scaling By factor, enter a value between 1 and 0. If you are scaling By distance, enter the distance from the edge of the block.
Enable datatips
Select this if you want to view selected information about the block model variables contained in each block. When you hover the cursor over a block within a slice, the appropriate variable information will be displayed.
If this check box is selected, the Block Model Datatip Variables panel will be displayed once the Dynamic Block Model Details panel has been completed.
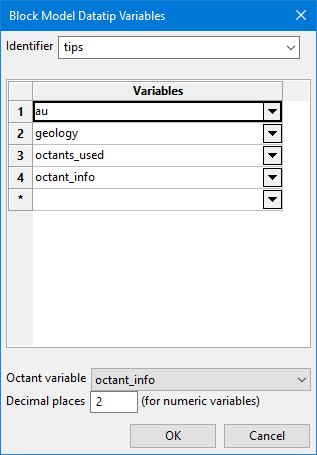
This panel allows you to create and define the template that contains the block model variables that you want to display. The template will be saved to a Block Identifier file
(.bif). This file is named after the name of the project, that is<project_name>.bif.-
Enter a unique name for the panel settings in the space labelled Identfier. The list can then be recalled at a later time by simply selecting the identifier from the drop-down list.
-
Select the variables that you want to display in the datatips. Up to 30 variables can be selected.
-
Select an Octant variable (optional) to hold the information regarding which octants were used in the in the estimation.
ImportantThe variable containing the octant information must be included in the Variables list and be selected as the Octant variable if you want to see it in the datatips. -
Set the number of decimal places you want to view. The number of decimal places enter here will not effect the actual number stored in the model. It is for display purposes only.
Setting up the option to view octant information
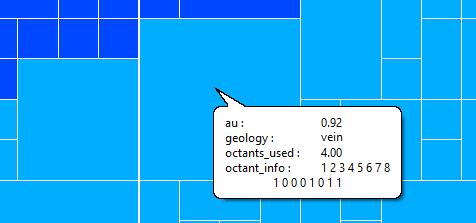
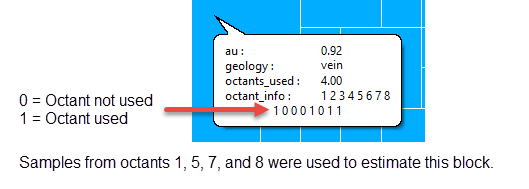
Vulcan stores information regarding whether or not samples from a particular octant were used during estimation. The octants are labelled 1 through 8. If samples from an octant are used during estimation, then the octant is flagged with a 1. If samples from an octant are not used, the octant is flagged with a 0. The variables used to record the number of octants used to estimate a block and record the flag information are stored in variables selected while setting up the estimation parameters.
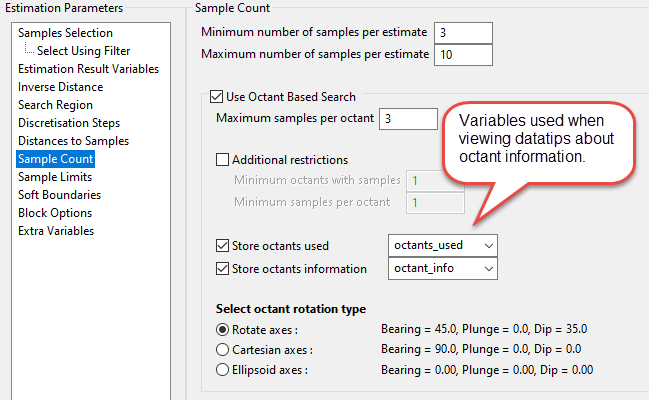
Figure 1 : Screenshot showing panel from Estimation Editor. For information about setting up the estimation variables, see setting up Sample Count .
In the datatips, the octant information is displayed as a small table with the octant number on top and the flag on the bottom.
 Apply Z offset
Select this option if you want to apply an offset to the slice when viewing it through a section view.
Display Block Text
Select this option to annotate the block model blocks within the resulting slice. The text annotations are displayed using a 3 x 3 grid layout and are defined through the Block Text panel.
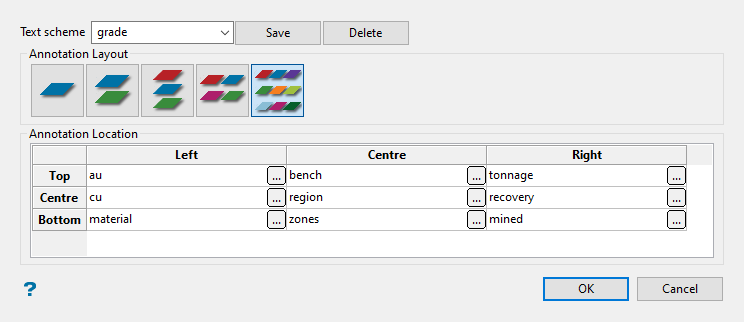
Follow these steps:
-
Type a name for the scheme in the textbox and click Save.
-
Select one of the five format layouts.

-
Click on the small
 button in the top left corner. This will cause the Block Model Variable Annotation panel to open.
 -
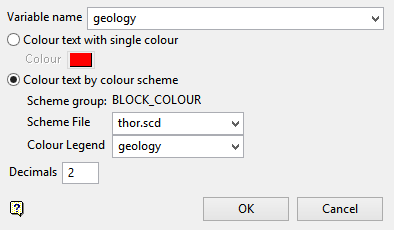
Select the variable information you wish to display from the drop-down list. Next, select the colour scheme you want to use to display the information. For static information such as block size, a single colour work well. However, for variables with dynamic ranges such as ore grades or rock types a colour scheme works well.
-
Click OK after making your selections to continue to the next caption.
 Display anisotropy vectors
Note
Display anisotropy vectors
NoteWhen displaying block models (regular or dynamic) the rendering of LVA vectors follows these conventions:
-
Will not be displayed if drawing individual block extents
-
Will be displayed if drawing block centroids
-
Will be displayed on Sliced Views
-
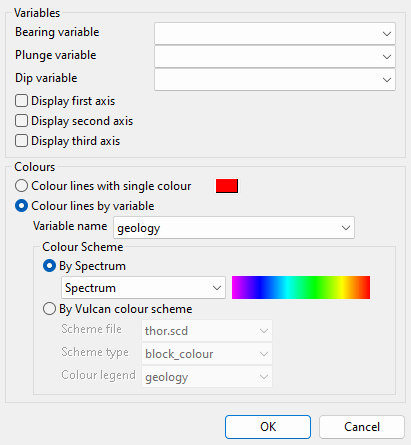
Click the Settings button to display the Anisotropy Vectors panel.
-
Select the variables for Bearing, Plunge, and Dip from the drop-down lists.
-
Select which axes to display. These axes refer to the major (first), semi-major (second), and minor (third) axes.
-
Set the display colours.
-
Colour lines with single colour - Select this option to colour the blocks all the same colour.
-
Colour lines by variable - Select this option to colour the blocks by variable value.
-
By Spectrum - Select this option to colour the slices by spectrum. This means that the colour spectrum is stretched over the variable values. Use the drop-down list to select the desired spectrum.
-
By Vulcan colour scheme - This option is similar to Colour by Spectrum in the way it varies by the variable values, but it does so by the customised colour scheme chosen by the user.
-
ClickOK to return to the main panel.
-
-
Set the colouring scheme for viewing the blocks.
-
By Spectrum - Select this option to colour the slices by spectrum. This means that the colour spectrum is stretched over the variable values. Use the drop-down list to select the desired spectrum.
-
Interpolate between two RGB values - Select this option to nominate two colours to stretch over the variable values. For example, if you select red and blue, then the small values would be red, the middle values purple, and the large values blue. The colour of the middle values is an average of the two chosen colours.
-
By Vulcan colour scheme - This option is similar to Colour by Spectrum in the way it varies by the variable values, but it does so by the customised colour scheme chosen by the user.
-
-
Select which blocks you want to display.
-
Select all blocks
Select this option to display all of the blocks in the block model.
-
Ignore blocks below cut-off
Select this option to display only those blocks that are above a specified value. This option can be used to hide low grade, or default, blocks.
-
Standard Criteria
Select this option to select blocks for display using the standard block selection criteria.
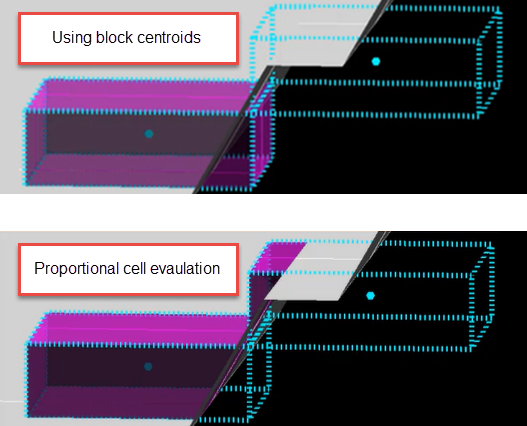
Use block centroids or Proportional cell evaluation
Decide whether you want to use the entire block in the calculations or only the portion that is within the regional boundaries. By default, the evaluation method is set to Proportional cell evaluation; however, you can select between Proportional cell evaluation and Use block centroids. This is especially important when using options such as Bounding triangulation, Bounding box, Section thickness, or Bounding surfaces.
 Mask by variable
Select this option if you want to restrict the blocks by a block model variable. You will need to specify the variable, as well as a particular value.
For example, to restrict blocks to those where Material equals Ore, select Material as the variable (from the drop-down list) and enter Ore as the value. However, if you require all blocks that do not have this specified value, then enable the Reverse selection check box. The block model variable may be numeric (e.g. the grade variable Au) or character (e.g. Geology) variables.
Use test condition
Select this option to use a further constraint upon a numeric block model variable, for example
Fe GT 10.0(iron value greater than 10.0). The maximum size of the condition is 132 alphanumeric characters. A list of available operators/functions is provided in Appendix B of the Core Documentation.Use bounding triangulation
Select to restrict the blocks by a triangulation. You will be required to specify the bounding triangulation.
Note: This option is not applicable to open or 2D triangulations.
Use bounding surfaces
Select to restrict the blocks by bounding surfaces. You will be required to select the upper (top) and lower (bottom) surface triangulations.
Use bounding box
Select to restrict the blocks by a box. You will be required to enter the coordinates for the minimum and maximum X, Y, and Z values in either model coordinates or real world coordinates.
Reverse selection
Select to exclude (not display) the selected blocks within the slice. This option works in combination with the other options on this panel.
If you set up Mask by variable to display all blocks that have a gold grade of (-99.0), then selecting Reverse selection will prevent any block with a gold grade of (-99.0) from being displayed.
Or if you set up a bounding box to limit Z values between 2300m and 5500m, selecting Reverse selection will prevent blocks with Z values between those elevations from being displayed and show blocks with all other Z values.
-
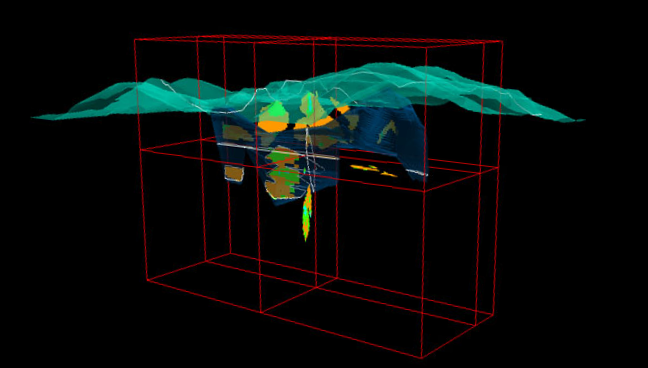
-
Click OK. The block model is loaded onto the screen.

