Tutorial - Creating a Variogram
Vulcan Data Analyser
This tutorial provides step-by-step instructions on how to create, display and save a variogram.
This tutorial uses a drillhole composite dataset which can be found here.
Opening Vulcan Data Analyser
- To begin, start Vulcan Data Analyser by launching Vulcan to the VDA Tutorial folder.
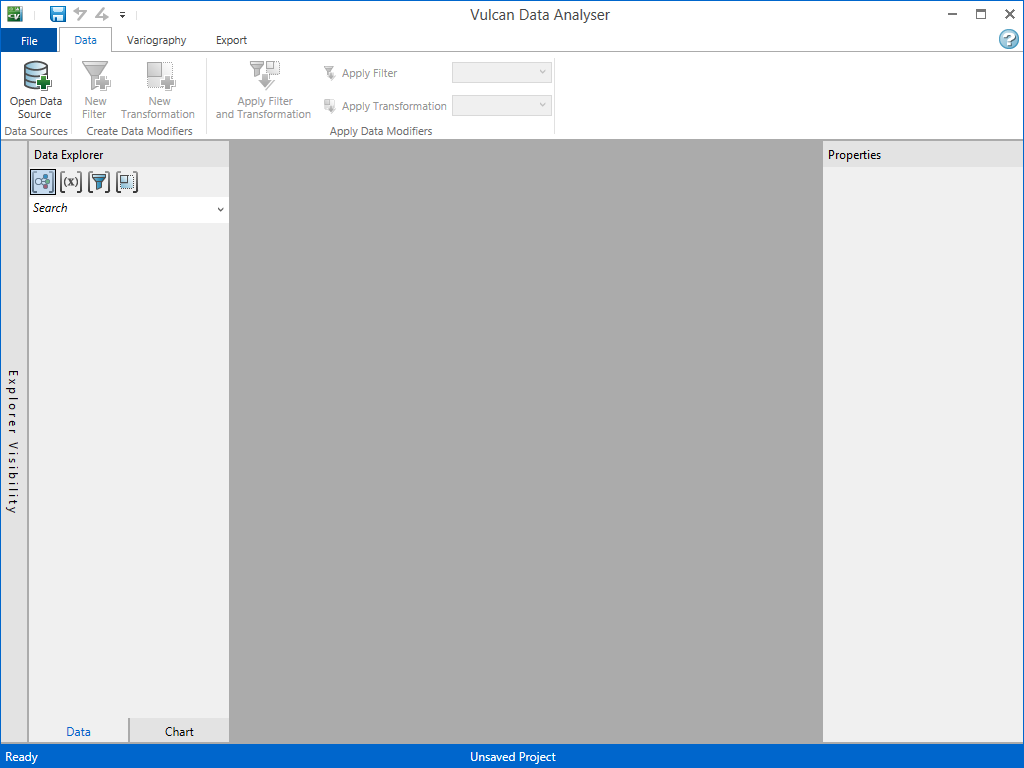
- On the Analyse menu, click Data Analyser. This opens up the main Vulcan Data Analyser window (VDA).
Loading your data
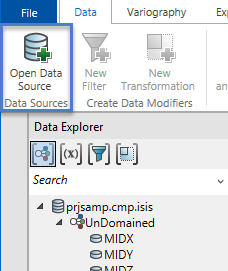
- On the Data tab, click Open Data Source. This will open a standard window's dialog where you may locate your desired file.
- Load prjsamp.cmp.isis.
In this tutorial, we are interested in studying the CU_NS.
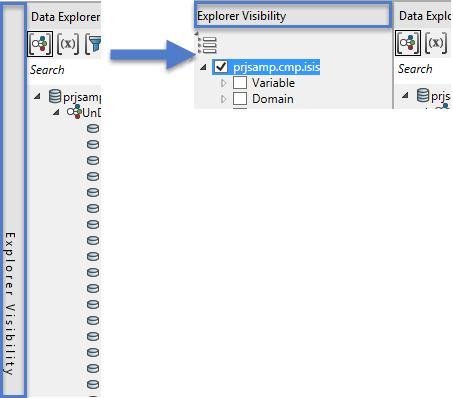
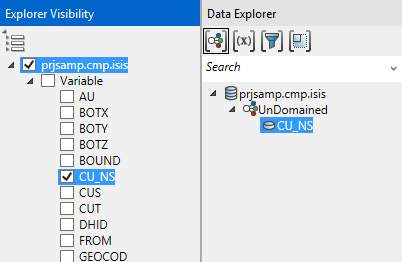
- Expand the Explorer Visibility tool by clicking anywhere on the title bar labelled 'Explorer Visibility', shown below as the area within the red border.
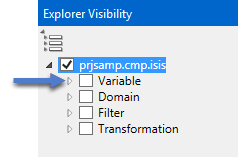
Next, click the arrow next to Variable to expand the tree and show the list of variables.
Now select CU_NS from both columns, as shown below.
Creating the variogram
The data is now loaded and ready to use in our analyses. Since we will not be altering the data we can begin creating the variogram.
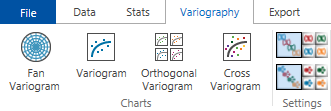
On the Variography tab, click Variogram.
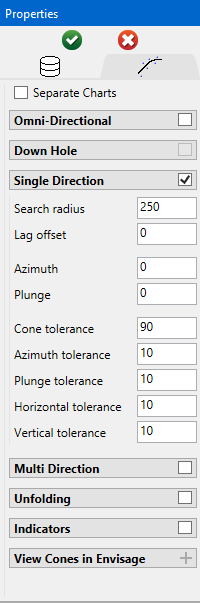
When you click Variogram, the Properties panel on the right will populate as shown below. There are a number of functions available, but we will focus on just a few of them.
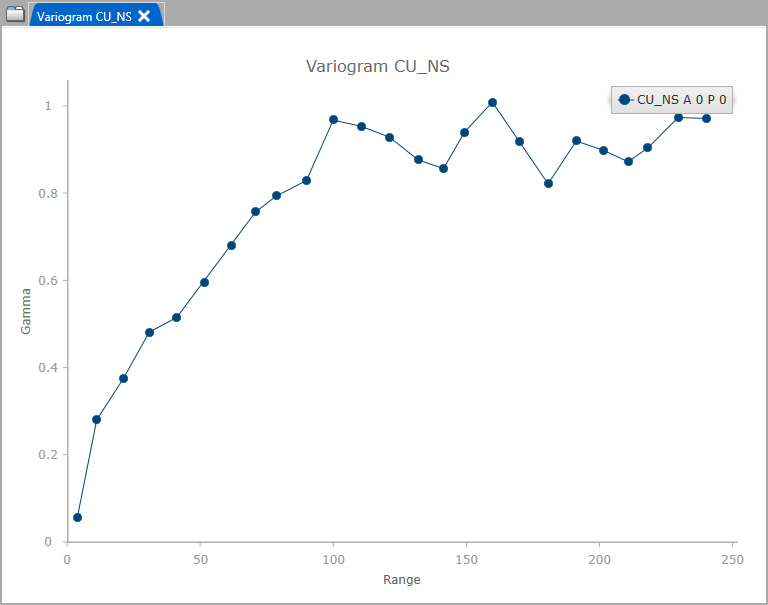
To create a basic variogram, click the green ![]() icon at the top. Doing so will produce a variogram like the one shown below.
icon at the top. Doing so will produce a variogram like the one shown below.
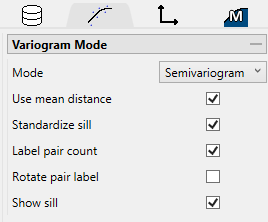
There are a number of dynamic adjustments we can make to the variogram. Make sure the Variogram Parameters ![]() icon is highlighted. Next, expand the menu for Variogram Mode and select the options as shown below.
icon is highlighted. Next, expand the menu for Variogram Mode and select the options as shown below.
Next, expand the menu for Direction Properties. Here we will adjust the lag distance. The drill spacing is approximately 70 feet for this dataset, so we will adjust the lag spacing to half that distance to 35 feet.
To model the variogram, click on the model ![]() icon and select the option by clicking the box. Click the Start Autofit button to begin calculations to fit the model to your data. The progress bar in the lower left corner of the Vulcan Data Analyser window will indicate how much time is left in the process.
icon and select the option by clicking the box. Click the Start Autofit button to begin calculations to fit the model to your data. The progress bar in the lower left corner of the Vulcan Data Analyser window will indicate how much time is left in the process.
Progress Bar
You have the option of leaving the model as it is or adjusting it either by using your mouse and clicking and holding to drag the small square on the model line or by adjusting the numbers directly in the boxes on the right hand side of the Properties panel.
To make visual chart adjustments, click on the Chart Settings ![]() icon. By expanding the Data menu you can change the colour and marker type. By clicking the arrows for Vertical Alignment in the Show Legend menu you can adjust the placement of the chart legend.
icon. By expanding the Data menu you can change the colour and marker type. By clicking the arrows for Vertical Alignment in the Show Legend menu you can adjust the placement of the chart legend.
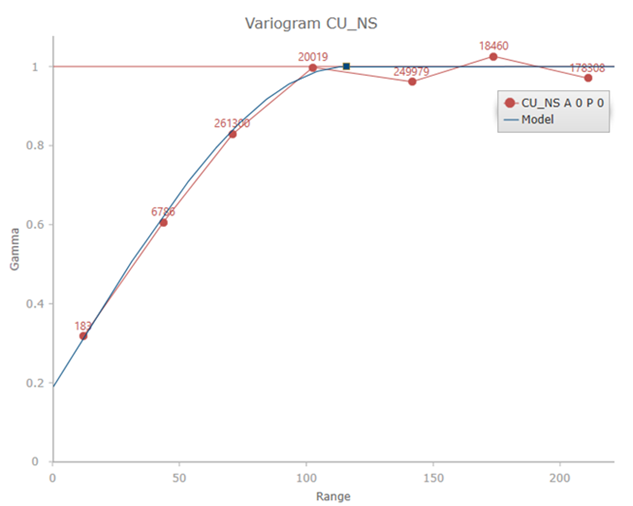
Completed variogram
Related topics

