Tutorial - Transforming Data
Vulcan Data Analyser
This tutorial provides step-by-step instructions on how to create, display and save a variogram.
This tutorial uses a drillhole composite dataset which can be found here.
In this tutorial, you will learn how to transform data.
- To begin, start Vulcan Data Analyser by launching Vulcan to the VDATutorial folder.
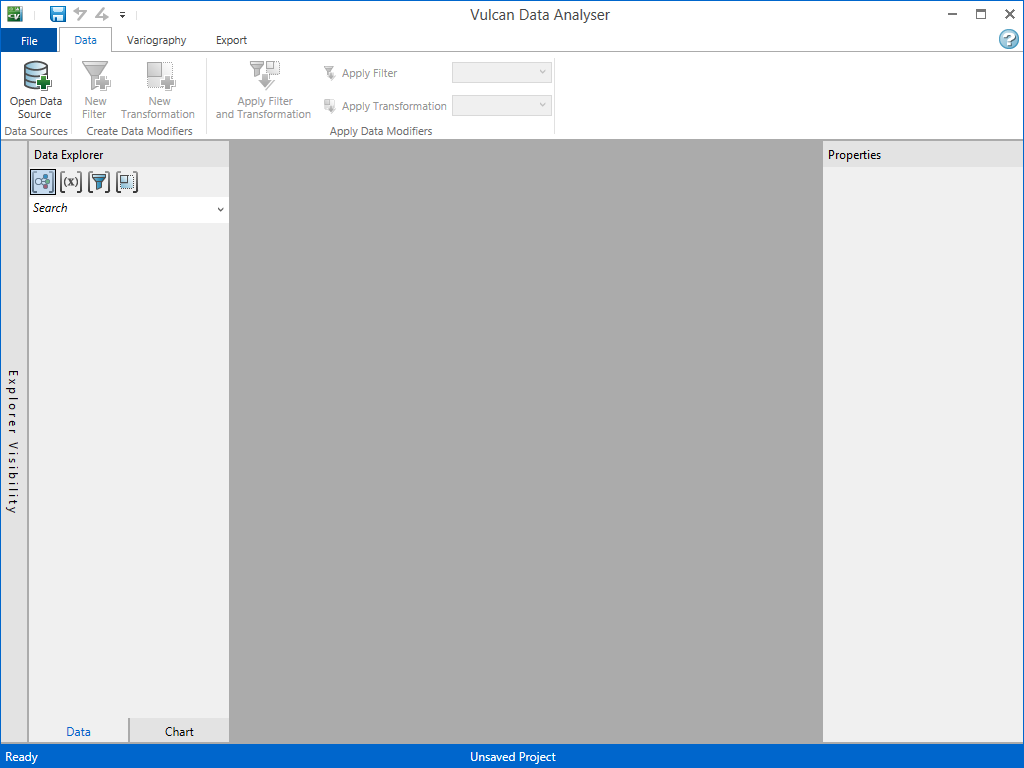
- On the Analyse menu, click Data Analyser. This opens up the main Vulcan Data Analyser window (VDA).
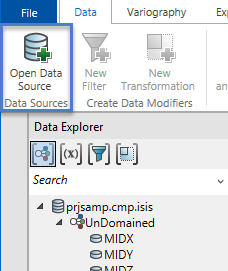
- On the Data tab, click Open Data Source. This will open a standard window's dialog where you may locate your desired file.
- Load prjsamp.cmp.isis.
In this tutorial, we are interested in studying the CU_NS and AU variables domained by the MINTY variable. To do so, we need to select our domains.
- Expand the Explorer Visibility tool by clicking anywhere on the title bar labelled 'Explorer Visibility', shown below as the area within the red border.
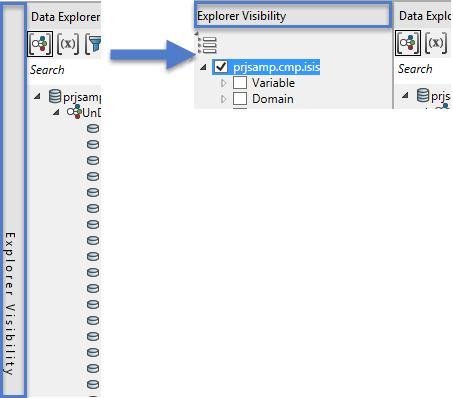
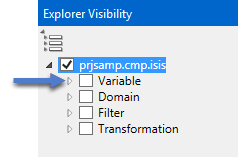
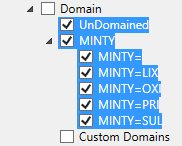
- Next, click the arrow next to Domain.
![]()
- View all the values of the MINTY variable by clicking the arrow next to it.
- We want to study all of the domains accept for the unspecified domain “(MINTY=)”. To do this, check the top level MINTY box. Now all of the sub boxes will be checked.
- Next, uncheck the (MINTY=) check box to exclude it.

- While you are in the Explorer Visibility area, you can hide the variables you are not working with. To do this, click the arrow next to Variable, then click AU and CU_NS. This will hide all the other variables you are not working with.
- Collapse the Explorer Visibility tool by clicking on Explorer Visibility.
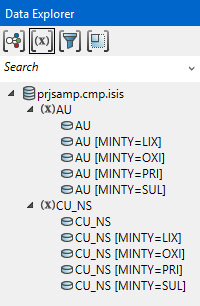
- By default, the Data Explorer is sorting Data Groups by domain. So, at the top you will see each variable in the database listed under UnDomained. You will also see them for each value of the MINTY variable.
- We are trying to study CU_NS and AU. To sort the data and make it easier, select Group By Variable icon at the top of the Data Explorer.
Now we would like to study the AU variable. But the AU variable is log normally distributed. So, we need to define a data transform.
- Ensure that one or more data groups are selected from the Data Explorer.
- On the Data tab, click New Transformation. This will open the Transformation panel as shown below.
- For the Transformation Name type ln.
- For the description type log normal transform.
- Change the type field to Log.
- Click the
 button.
Now we will create new data groups that are log transformed.
- Select all the AU data groups from the data explorer
- On the Data tab, click Apply Transformation.
This creates 5 new data groups, one for each domain and undomained that have the Ln transform applied.
- Switch the data explorer to group by transformation by clicking on Group by transformation
 icon at the top of the data explorer. Now all the ln transformed data groups are listed together under ln.
![]()
Related topics

