Draw Legend
Use the Draw Legend option to load a colour legend into a nominated layer. Once loaded, the legend can then be plotted.
Instructions
On the Analyse menu, point to Legend Edit, and then click Draw Legend to display the Select scheme and legend panel.
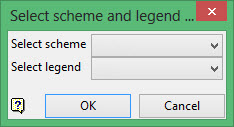
Select the required scheme and legend and then click OK to display the Load scheme to layer panel.
A list displays of all the schemes for which legends exist. Select the required scheme. A similar list is then displayed of the legends in the selected scheme. Select the legend that is to be put into a layer.
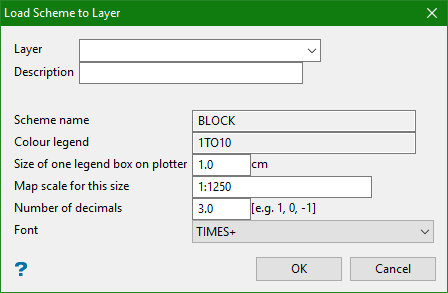
Layer name
Select a layer from the drop-down list, or enter a name for a new layer. The name of the new layer:
-
may contain up to 40 characters,
-
must begin with an alphanumeric character [0-9] or [a-z],
-
cannot include spaces,
-
can include hyphens [ - ], plus signs [ + ], underscores [ _ ], periods/dots [. ],
-
can include the special characters of ÁÂÃÀÇÉÊÍÓÔÕÚÜÑ that are used in the Spanish and Portuguese languages.
If you select an existing layer that is already loaded, subsequent digitising will be appended to this layer. If you select an existing layer that is not loaded, you will need to confirm whether you want to load the layer or replace it, overwriting the original contents.
Description
Enter a description to further describe the contents of this layer. The maximum size is 80 alphanumeric characters. Spaces are allowed. If a description is not entered, then a default description will be used instead. If the chosen layer already has an assigned description, then this will be displayed when the layer is selected. Existing layer descriptions can be overwritten.
Scheme name
Refers to the name of the selected scheme. This value can be overwritten.
Colour Legend
Refers to the name of the selected colour legend. This value can be overwritten.
Size of one legend box on plotter
Enter the size of one legend box on a plot. The map scale and this value will be used to determine the size of the legend on the screen.
Example: If the size is set to 0.30cm and the map scale to 1:100, the legend boxes will appear as 30 units. Setting the scale to 1:1000 would result in boxes of 300 units, a scale of 10 000 in boxes of 3000 units and so forth.
Map scale for this size
Enter, as a ratio, the drafting scale, which is used in conjunction with the text size entered above.
If the text size is set to '0.10' (10 cm), and the drafting scale to '1:1250', then the text will appear on the screen the same size as an object that is 125 units long. Changing the scale, through either this option or the File > Plot > Plot All option to '1:1000' will result in the text appearing the same size as an object that is 100 units long. Changing the scale to '1:10 000' results in a text size of 1000 and so forth.
Number of decimals
Enter the number of decimal places to be displayed in the legend. The maximum number is 5.
Font
Select the font from the drop-down list. The font will be sourced from 3D Text Defaults in Preferences and using TIMES+ if defaults are disabled.
Note: Fixed fonts, which are also known as non-transformable fonts, remain the same size when displayed onscreen regardless of the current zoom, and will always appear 'face on' (horizontal) regardless of the drafting angle. True Type fonts, unlike fixed fonts, will resize as you zoom in or out.
Click OK.
Indicate the legend position. The legend is then placed on the screen. You will then be returned to the Indicate position prompt. Cancel when you have finished loading colour legends.
Note: The Remove option (under the File > Layers submenu), or the Remove Layer button on the Standard toolbar, can be used to remove the legend from the screen.

