Tutorial - Chart Viewing and Exporting
Vulcan Data Analyser
This tutorial provides step-by-step instructions on how to open and view previously created variograms, and then export them as either a.png or.csv file.
Note: In this tutorial, you will need files created during previous Vulcan Data Analyser tutorials or previously generated variogram files made with the Vulcan Data Analyser on your own.
- To begin, start Vulcan Data Analyser by launching Vulcan to the VDATutorial folder.
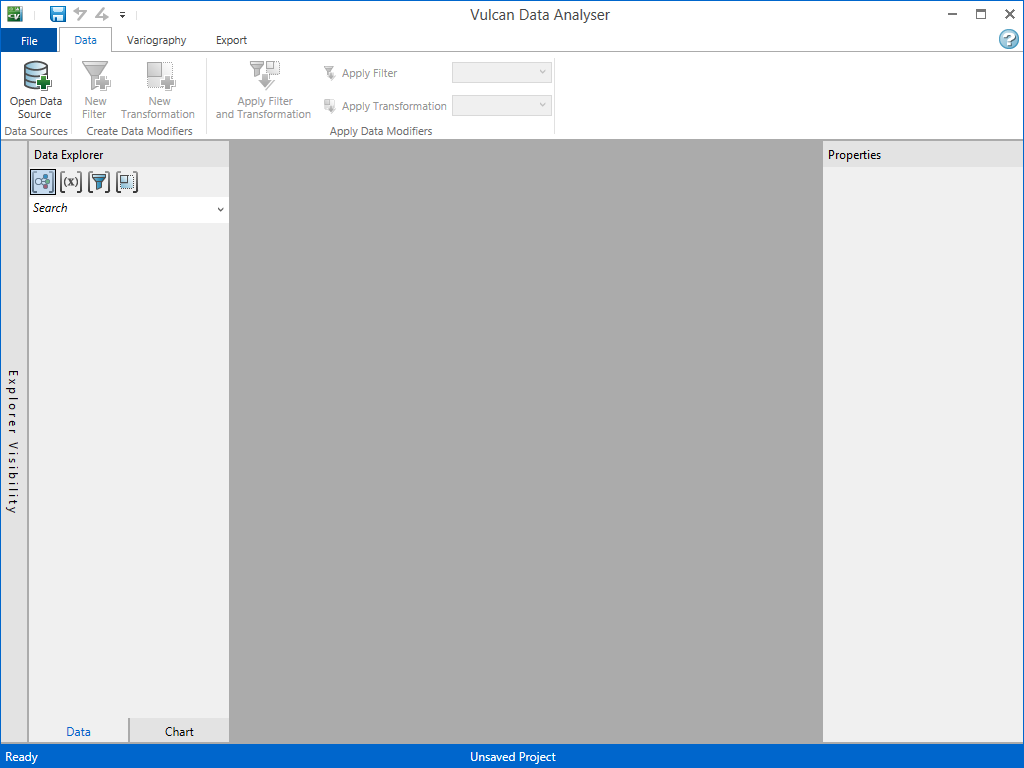
- On the Analyse menu, click Data Analyser. This opens up the main Vulcan Data Analyser window (VDA).
Load the project that you saved during the Creating a Variogram tutorial.
-
On the File tab, click Open.
Your file should be listed in the Recent Files list. If it is, pick it. If not, click Open Project and navigate to it.
You should see that your data explorer is as you left it. The transformed, domained, and filtered data groups will still exist.
Also, there are a number of open charts. Lets start with them all closed.
-
Pick a chart and right click on its tab.
Note: the options...
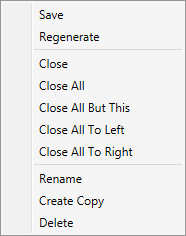
For now simply choose Close all.
If prompted to save, select yes.
Now all your charts are closed. But they are not lost. You can reopen them from the Chart Explorer. On the bottom of the Data Explorer is a tab titled Chart. Note all the charts you have made are listed under “Unopened Charts”. If necessary you can expand the Chart Explorer by clicking and dragging on its right edge. You can switch back to the Data Explorer by clicking the Data tab.
Let’s re-examine the domained CU_NS charts.
-
Use CTRL + Click to select the charts titled “Variogram CU_NS [MINTY=#]” where # is the MINTY value.
-
Right click and pick Open
You should now see four chart tabs. One for each domain.
-
Try using the right and left arrow keys to switch between tabs.
Let’s look at all the charts in a Grid View
-
Click the folder icon directly to the left of the leftmost open chart tab.
-
Click Grid View.
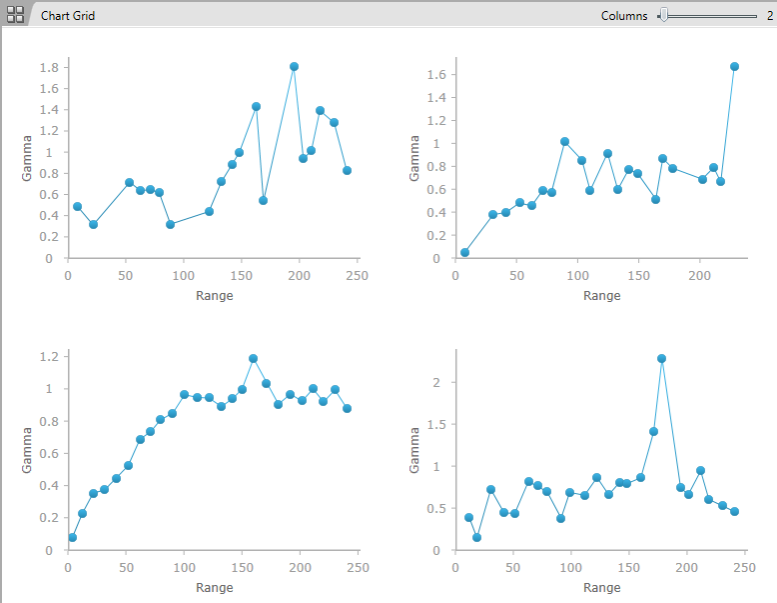
Now you can see all 4 open charts at once.
-
Change the number of columns to 2 using the columns slider on the top right.
The default parameters are not acceptable for these charts. Lets change them.
-
Pick one of your charts by clicking on it in the grid.
-
Expand the Directional Properties section of the Properties window on the right.
-
Change the Horizontal tolerance and Vertical tolerance to 10000.
-
Use the lag slider to adjust the lag size until the variogram begins to look more smooth
Now we want to apply these settings to all the variograms.
-
Select all 4 variograms. Be sure to not select the edited variogram first.
Note: that the Lag size and Horizontal and Vertical tolerances have been highlighted with yellow borders. This is to indicate that the values are not the same for all selected charts.
-
Type in the values from your edited variogram.
Now all four variograms have the same properties and the yellow borders are no longer visible. You can also make chart selections for editing this way from the Chart explorer by holding down shift, then clicking on open charts.
-
Now switch back to the tabbed view from the menu in the top left of the chart area.
If we want to examine the specific numeric values of a chart we can export them to a CSV.
-
Make sure one of your charts is visible. then on the Edit tab, click CSV.
-
Name your file and click save.
The resulting file contains all the variography numerical data for easy comparison.
-
Now pick Analyse_Tutorials_the.png icon.
A preview of your chart export is provided.
In the top left of the preview window is the Documents combo box. Right now it says “Selected (1)”.
-
Change it to Open (4).
Note: that in the bottom right it now displays ¼.
You can use the slider or text box to view the individual charts you will be exporting.
-
To export only the chart you are previewing, select Export Page.
-
To export all the selected documents, select Export All.
Related topics

